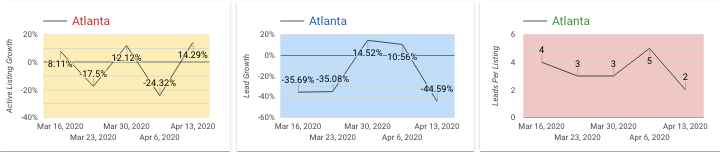
Atlanta
Data Highlights:
- Active Listings: Atlanta’s active listings are on the rise posting a 14% increase week over week.
- New Listings: Last week gains were up 11%, this week another 11% gain was reported.
- Renter Leads: Atlanta has been up and down this week ended with nearly a 50% loss in the number of leads.
- Average Renter Leads Per Property: After a steep decline the first week, leads per property was inching back up, but ended this week at just two.
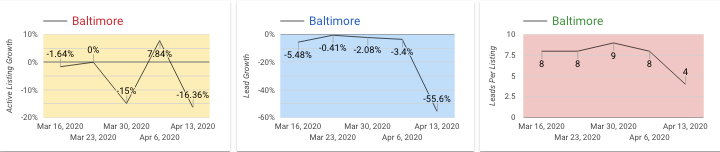
Baltimore
Data Highlights:
- Active Listings: Baltimore listing saw a nice gain of nearly 8% last week, but ended the week of the 13th with a 16% decline.
- New Listings: 68% net loss for this reporting period through April 19th.
- Renter Leads: Leads took a sharp decline this week with a 56% loss.
- Average Renter Leads Per Property: This number was cut in half, going from eight to four week over week.
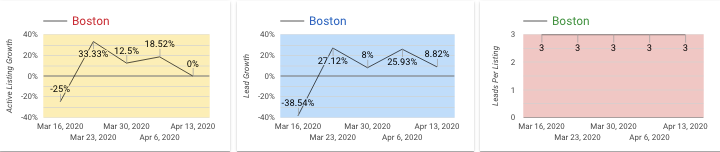
Boston
Data Highlights:
- Active Listings: Boston’s active listings stayed steady week over week.
- New Listings: A great gain this week at 160% increase since the beginning of March.
- Renter Leads: A slight decrease of 9% week over week.
- Average Renter Leads Per Property: The average has held steady at three per property for the last four weeks.
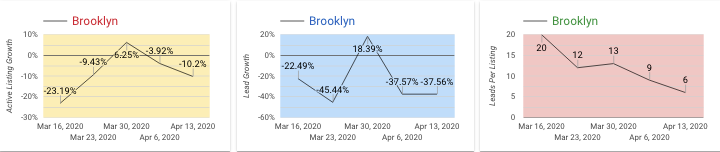
Brooklyn
Data Highlights:
- Active Listings: Brooklyn saw a 10% decrease last week in the number of active listings.
- New Listings: A 26% net loss reported last week since the beginning of March.
- Renter Leads: For the second week in a row a nearly 38% decrease in leads was reported.
- Average Renter Leads: Consistent with other losses, average leads per property is down from nine to six.
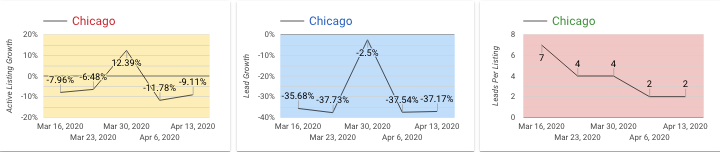
Chicago
Data Highlights:
- Active Listings: Chicago listing had a 9% decrease this week.
- New Listings: 55% net loss in new listings since the beginning of March.
- Renter Leads: Renter leads continue to be hit hard this week with a 37% decrease.
- Average Renter Leads: The average held steady this week at two leads per property.
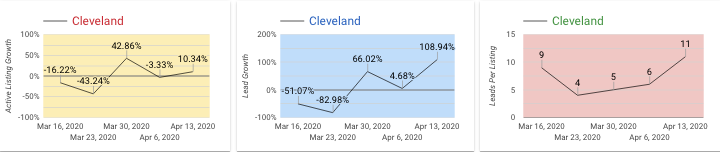
Cleveland
Data Highlights:
- Active Listings: Cleveland had a nice up tick this week with a 10% increase in active listings.
- New Listings: There is an 80% increase in new listings.
- Renter Leads: Cleveland has a great jump this week with nearly a 110% increase in renter leads.
- Average Renter Leads: Trending in line with other metrics, the average number of leads per property is 11, almost doubling from last week.
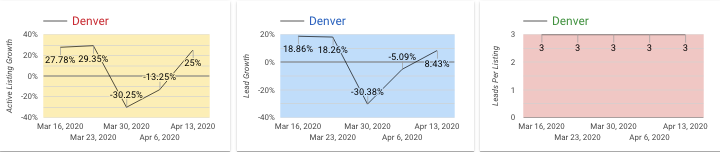
Denver
Data Highlights:
- Active Listings: Denver saw a great increase of 25% in active listings this week.
- New Listings: Denver experienced a -51% net loss in new listings since the beginning of March.
- Renter Leads: Denver saw nearly a 9% increase in lead growth last week.
- Average Renter Leads Per Property: Leads in Denver have stayed the same throughout the month sitting at three per property.
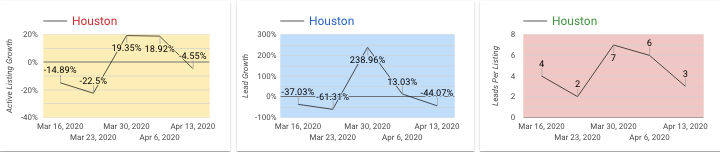
Houston
Data Highlights:
- Active Listings: Houston active listings took a small hit of around 5% last week.
- New Listings: A 33% net lost since the beginning of March.
- Renter Leads: Houston’s leads are down 44% for the week ending April 19th.
- Average Renter Leads Per Property: Houston’s leads per property was cut in half this week, going from six to three.
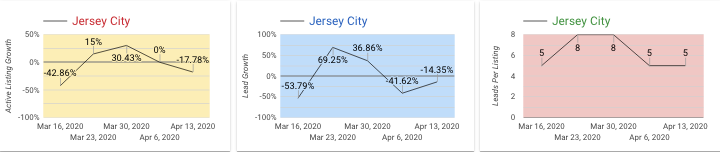
Jersey City
Data Highlights:
- Active Listings: Jersey City active listings took an 18% decrease last week.
- New Listings: 89% net loss in new listings since the beginning of March.
- Renter Leads: Renter leads were down again at 14%.
- Average Renter Leads Per Property: Average leads per property held steady at five this week.
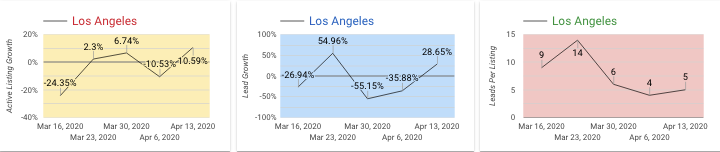
Los Angeles
Data Highlights:
- Active Listings: Los Angeles had nearly an 11% increase in active listings this week.
- New Listings: A net loss of 29% in new listings since the beginning of March.
- Renter Leads: Leads grew 29% last week.
- Average Renter Leads Per Property: The average number of leads per listing ticked up one, ending the week at five.
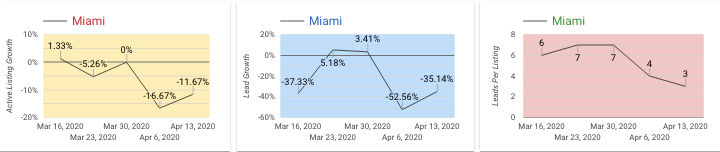
Miami
Data Highlights:
- Active Listings: Miami posted another loss this week of nearly 12%.
- New Listings: Miami saw a nice jump of 77% in new listings since the beginning of March.
- Renter Leads: Leads growth was still down at 35% for the week ending April 19th.
- Average Renter Leads Per Property: Miami’s average leads per property took another point off this week, ending at just three.
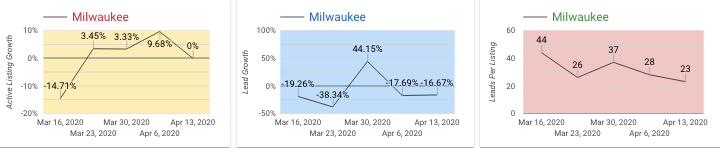
Milwaukee
Data Highlights:
- Active Listings: Milwaukee held steady for the week ending April 19th.
- New Listings: 11% net gain for this reporting period.
- Renter Leads: Lead growth took another hit of nearly 17% this reporting period.
- Average Renter Leads Per Property: Milwaukee started with a strong amount of average leads at 44 and is now at 23 for this reporting period.
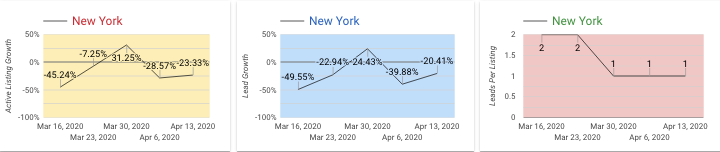
New York
Data Highlights:
- Active Listings: New York decreased again this week posting a 23% loss.
- New Listings: 69% net loss for this reporting period.
- Renter Leads: New York saw another decrease in leads this week at 20%, not as much as the previous week which posted nearly a 40% loss.
- Average Renter Leads Per Property: New York’s average leads have stayed consistent and is currently at one.
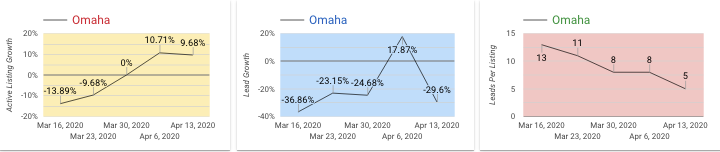
Omaha
Data Highlights:
- Active Listings: Omaha is still in the black for active listings posting another increase of nearly 10%.
- New Listings: -25% net loss for this reporting period.
- Renter Leads: Omaha started positive at 27.08% and decreased throughout the month, recovered a bit, but took another hit last week of nearly 30%.
- Average Renter Leads Per Property: Omaha started the month strong with 13 leads and has decreased and is sitting at five leads per property.
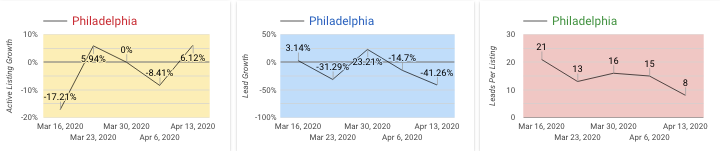
Philadelphia
Data Highlights:
- Active Listings: Philadelphia posted a 6% increase in active listings last week.
- New Listings: 38% net loss for this reporting period.
- Renter Leads: Philadelphia have been trending down the last couple of weeks with a 41% decrease posted last week.
- Average Renter Leads Per Property: Philadelphia’s leads per property were almost cut in half ending last week at eight.
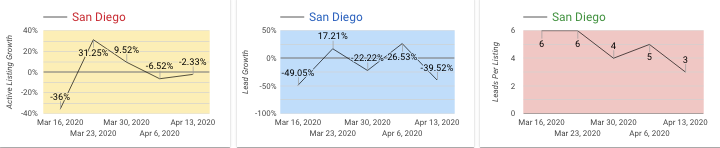
San Diego
Data Highlights:
- Active Listings: San Diego active listings saw a slight decrease of 2%.
- New Listings: 11% net loss in listings since the beginning of March.
- Renter Leads: San Diego renter leads took nearly a 40% hit last week.
- Average Renter Leads Per Property: San Diego’s leads slowly decreased during March and April and currently sit at three per property.
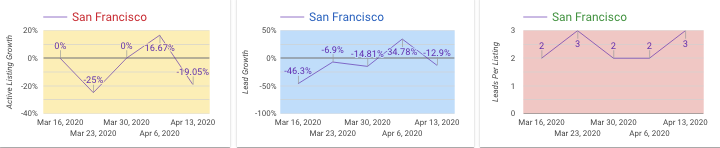
San Francisco
Data Highlights:
- Active Listings: San Francisco listings took a 19% hit last week.
- New Listings: 20% net loss for this reporting period.
- Renter Leads: San Francisco saw a nice jump last week, but took a 13% hit last week.
- Average Renter Leads Per Property: The average number of leads per property tick up one last week, ending at three.
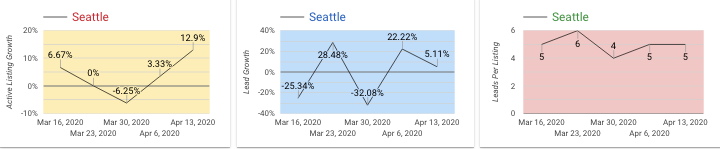
Seattle
Data Highlights:
- Active Listings: Seattle has seen a couple of nice up ticks in the last weeks with a 13% increase last week.
- New Listings: 13% net loss for this reporting period.
- Renter Leads: Seattle posted another increase in leads this week, ending up 5%.
- Average Renter Leads Per Property: Seattle’s lead average has held steady at five for the last two weeks.
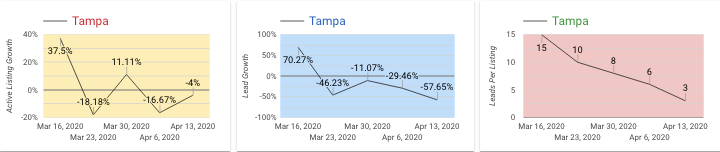
Tampa
Data Highlights:
- Active Listings: Tampa’s listings were down a bit at 4% last week.
- New Listings: 33% net loss for this reporting period.
- Renter Leads: Tampa took a big hit in lead growth with nearly a 60% decrease.
- Average Renter Leads Per Property: Tampa’s leads have steadily declined, ending last week at three per property.