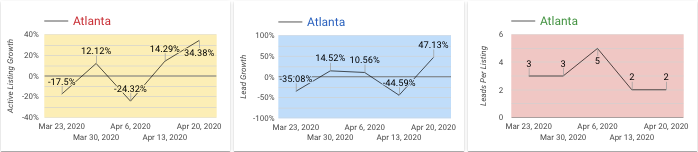
Atlanta
Data Highlights:
- Active Listings: Atlanta’s active listings are on the rise reporting nearly a 35% increase this week.
- New Listings: This is the first time in nearly two weeks a loss was reported in new listings clocking in with a 17% decrease since the beginning of March.
- Renter Leads: Atlanta renter leads saw a great increase this reporting period with nearly a 50% increase.
- Average Renter Leads Per Property: Average renter leads per property head steady this week at two.
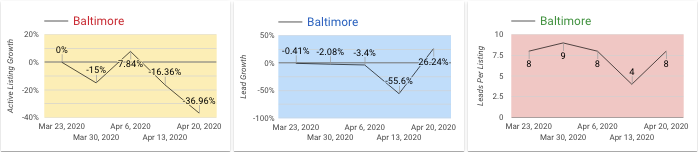
Baltimore
Data Highlights:
- Active Listings: Baltimore continues on a downward trend with nearly a 40% decrease this reporting period.
- New Listings: A 58% net loss was reported this week, up a bit from the 68% net loss reported the previous week.
- Renter Leads: Leads had a nice increase of 26% this week.
- Average Renter Leads Per Property: In line with the increase in total leads, the average nearly doubled, ending the week at eight per property.
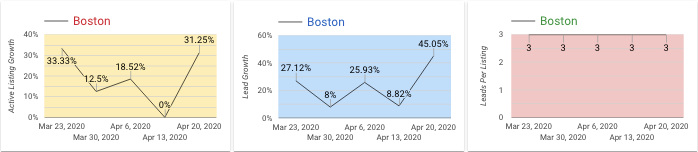
Boston
Data Highlights:
- Active Listings: Boston’s active listings had a nice gain of just over 30% for the week.
- New Listings: Another great gain this week at 180% increase, beating last week’s 160% gain since the beginning of March.
- Renter Leads: Great gains in renter leads as well, posting nearly a 50% gain week over week.
- Average Renter Leads Per Property: The average has held steady at three per property for the last four weeks.
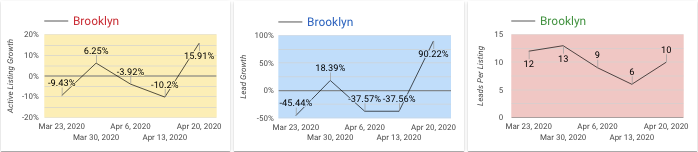
Brooklyn
Data Highlights:
- Active Listings: Brooklyn saw a 16% increase this week in active listings.
- New Listings: New listings are still down since the beginning of March with a 67% loss reported since the beginning of March.
- Renter Leads: Renters are getting out there, a 90% increase in lead growth was reported week over week.
- Average Renter Leads: Consistent with leads gains, the average shot up two points this week ending at 10 on average.
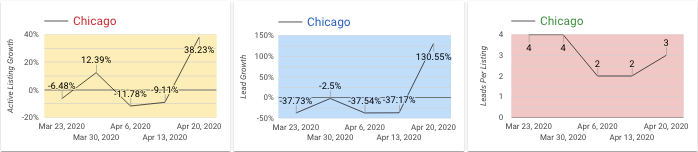
Chicago
Data Highlights:
- Active Listings: Chicago saw nearly a 40% increase week over week.
- New Listings: 51% net loss in new listings since the beginning of March.
- Renter Leads: Renter leads had great gains this week with a 130% increase reported.
- Average Renter Leads: The average ticked up one ending the week at three on average per property.
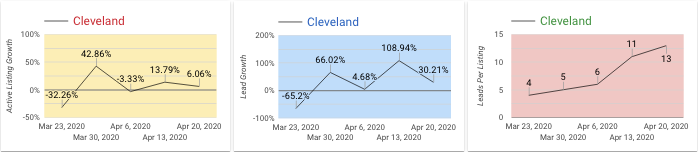
Cleveland
Data Highlights:
- Active Listings: Cleveland had another nice uptick this week at 6%.
- New Listings: There is a 20% increase in listings reported since the beginning of March.
- Renter Leads: After a 110% increase reported the previous week, another great gain at 30% was clocked this week.
- Average Renter Leads: Another uptick this week in the average ending the reporting period at 13 leads per property.
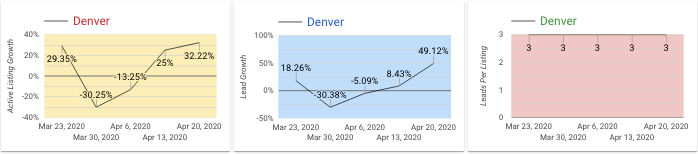
Denver
Data Highlights:
- Active Listings: Denver has reported increases for the last two weeks, this week comes in at 32% week over week.
- New Listings: New listings are still down since pre-COVID-19 days posting an 88% loss this week since the beginning of March.
- Renter Leads: Denver saw another great increase this week with nearly a 50% increase in leads.
- Average Renter Leads Per Property: Leads in Denver have stayed the same for the last four weeks, sitting at three per property.
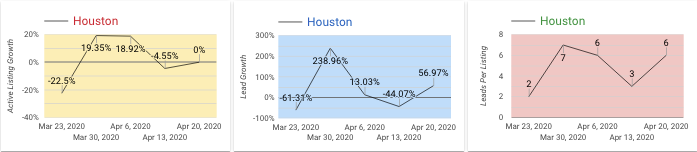
Houston
Data Highlights:
- Active Listings: Houston active listings held steady this week.
- New Listings: A 33% net lost since the beginning of March.
- Renter Leads: Houston’s leads are down 88% for the week ending April 26th.
- Average Renter Leads Per Property: Houston’s leads per property nearly doubled this week shooting back up to six.
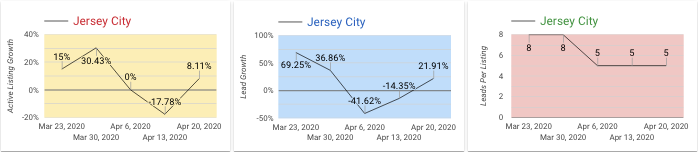
Jersey City
Data Highlights:
- Active Listings: Jersey City active listings saw an 8% increase this week.
- New Listings: After a couple weeks of losses, Jersey City posted a 32% increase in new listings since the beginning of March.
- Renter Leads: Renter leads had a nice gain of 22% week over week.
- Average Renter Leads Per Property: Average leads per property held steady at five again this week.
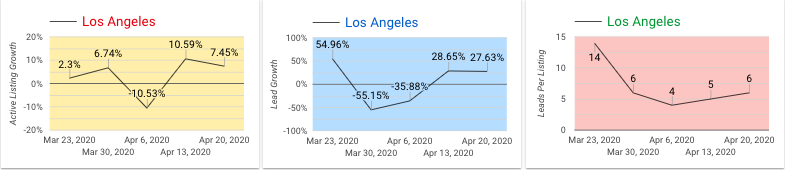
Los Angeles
Data Highlights:
- Active Listings: Los Angeles had nearly an 11% the previous week, and reporting another gain of nearly 8% this week.
- New Listings: A net loss of 18% in new listings since the beginning of March.
- Renter Leads: Leads grew 28% last week, posting double digit increases for the second week.
- Average Renter Leads Per Property: The average number of leads per listing ticked up one, ending the week at six.
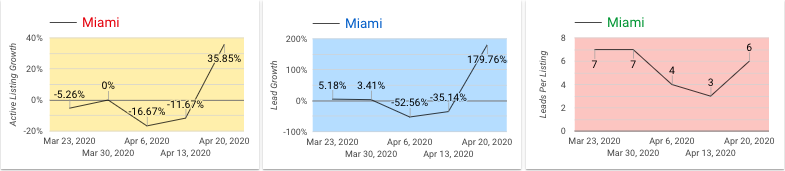
Miami
Data Highlights:
- Active Listings: Miami posted it’s first gain in four weeks at 36%.
- New Listings: A 44% increase in new listings since the beginning of March was reported.
- Renter Leads: Another great gain in the lead category, with nearly a 200% increase week over week.
- Average Renter Leads Per Property: Miami’s average leads per property doubled this week, ending at six per property.
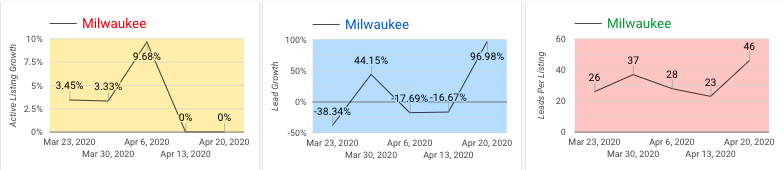
Milwaukee
Data Highlights:
- Active Listings: Milwaukee held steady for the second week in a row.
- New Listings: New listings are sitting right where they were at the beginning of March.
- Renter Leads: After two weeks of losses reported, a stellar increase of nearly 100% was reported week over week.
- Average Renter Leads Per Property: Milwaukee has recovered nicely in the average leads per property section nearly doubling and ending the week at 46.
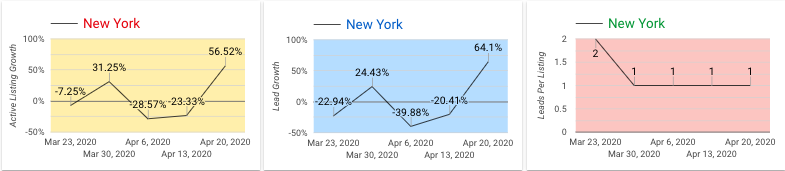
New York
Data Highlights:
- Active Listings: After two weeks of losses reported, this week came in strong with nearly a 60% increase in the number of active listings.
- New Listings: A 71% loss in new listings since the beginning of March was reported.
- Renter Leads: After two weeks of losses reported for leads, they experienced some nice recovery reporting a 64% increase week over week.
- Average Renter Leads Per Property: New York’s average leads have stayed consistent and is currently at one.
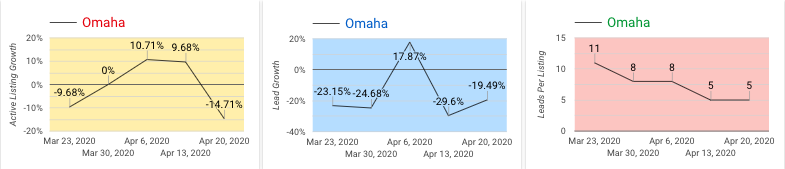
Omaha
Data Highlights:
- Active Listings: After two weeks of gains, Omaha posted a 15% loss in active listings this week.
- New Listings: 125% net gain for this reporting period.
- Renter Leads: Omaha was down again this week in leads, reporting nearly a 20% loss.
- Average Renter Leads Per Property: Omaha has seen steady declines in the average number of leads per property, but held at five to end the week.
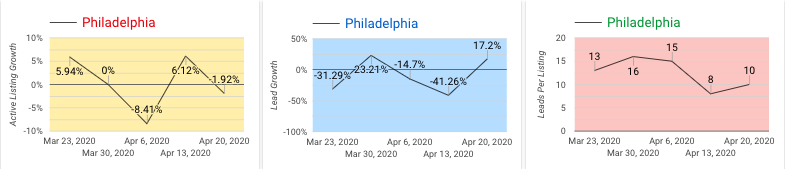
Philadelphia
Data Highlights:
- Active Listings: Philadelphia posted a slight decrease of 2%.
- New Listings: 19% net loss for this reporting period.
- Renter Leads: Philadelphia saw a nice increase this week at 17%.
- Average Renter Leads Per Property: Philadelphia’s leads per property ticked up two this week ending at 10.
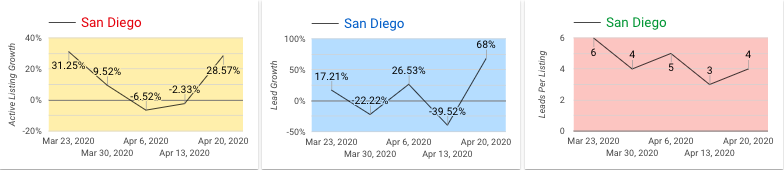
San Diego
Data Highlights:
- Active Listings: San Diego active listings posted a nice increase of nearly 30% week over week.
- New Listings: 6% net gain in listings since the beginning of March.
- Renter Leads: San Diego renter leads saw a great gain this week of nearly 70%.
- Average Renter Leads Per Property: San Diego’s leads slowly decreased during March and April and recovered by one this week, ending at four leads per property.
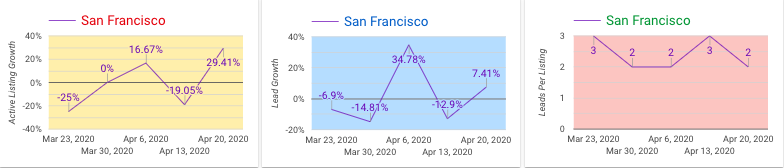
San Francisco
Data Highlights:
- Active Listings: San Francisco listings took a 19% hit the previous reporting week, yet posted a great gain this week of nearly 30%.
- New Listings: 40% net loss for this reporting period.
- Renter Leads: San Francisco leads posted a gain this week as well of just over 7%.
- Average Renter Leads Per Property: The average number of leads per property ticked down one last week, ending at two.
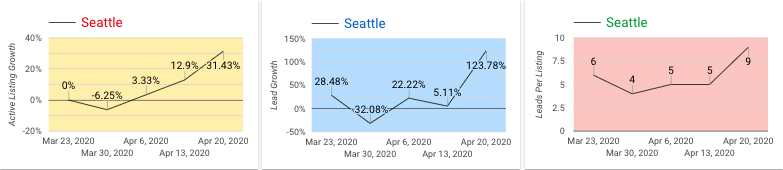
Seattle
Data Highlights:
- Active Listings: Seattle has seen a couple of nice up ticks in the last weeks with a 31% increase last week.
- New Listings: 13% net gain for this reporting period.
- Renter Leads: Seattle posted another increase in leads this week, ending up nearly 130%.
- Average Renter Leads Per Property: Seattle’s lead average was holding steady at five, yet nearly doubled this week ending at nine.
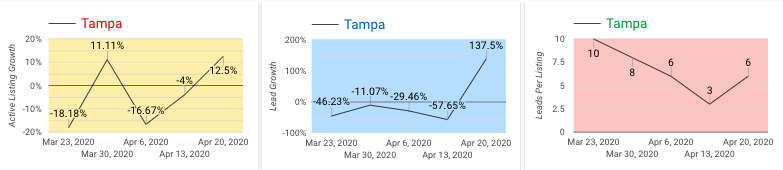
Tampa
Data Highlights:
- Active Listings: Tampa’s listings were down a bit the previous week, but posted a 12.5% increase this week.
- New Listings: 39% net loss for this reporting period.
- Renter Leads: Tampa has taken big hits in lead growth but came back strong this week with nearly a 140% increase reported.
- Average Renter Leads Per Property: Tampa’s leads were steadily declining, but nearly doubled this week ending at six per property.