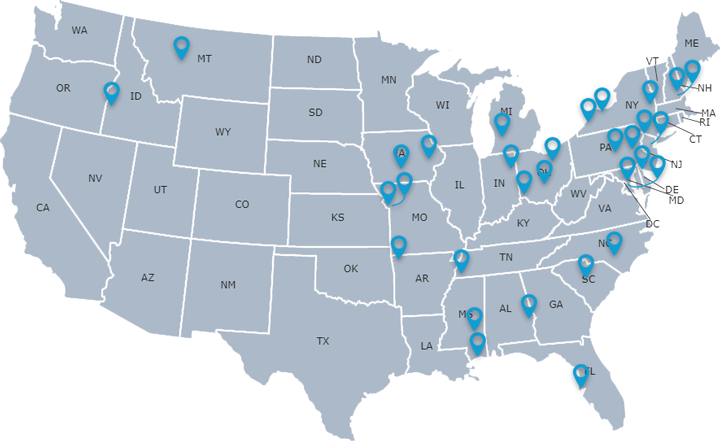
 # 1: Reading, PA #2: District Heights, MD #3: Allentown, PA #4: East Orange, NJ #5: Nashua, NH #6: Cincinnati, OH #7: Paterson, NJ #8: New Castle, DE #9: Rochester, NY #10: Hyattsville, MD #11: Akron, OH #12: Manchester, NH #13: Buffalo, NY #14: Schenectady, NY #15: Grand Rapids, MI #16: Columbia, SC #17: Memphis, TN #18: Gulfport, MS #19: Independence, MO #20: Columbus, OH #21: Des Moines, IA #22: Kansas City, MO #23: Great Falls, MT #24: Fayetteville, NC #25: St Petersburg, FL #26: Caldwell, ID #27: Rogers, AR #28: Cedar Rapids, IA #29: Fort Wayne, IN #30: Laurel, MS #31: Auburn, AL
 The Best Places to Buy a Rental Investment Property list was curated from our TurboTenant Reports, which highlighted the best places to buy a rental investment property in each state. The success of our first round of reports led us to create the best of the best when it comes to investing in rental properties.
Our first round of reports featured over 150 cities, we narrowed the 2020 list down to 31 great investment locations. Our use of the number of days on the market, the number of leads a property receives, along with rent, and home sales information has proven to be an excellent formula for identifying investment opportunities. To determine the top cities, we compared the average rent with the monthly mortgage payment. The terms were set at 30 years, with a 20% down payment, and a 4.1% interest rate, which is the current national average. If positive numbers were reported in all categories, the location made the list.
#31: Auburn, AL
- Motto: “The Loveliest Village On The Plains”
- Data Highlights: Auburn takes second place for the highest population growth, and number one for employment growth.
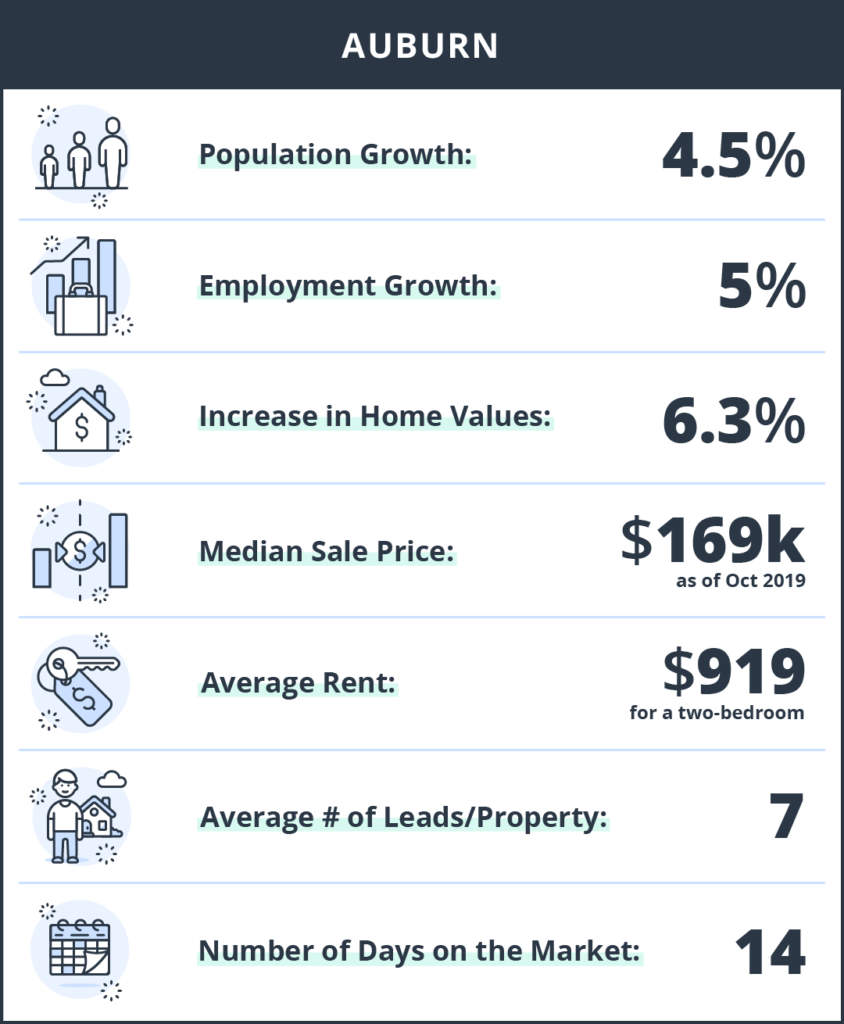
- Population growth: 4.5%
- Employment growth: 5%
- Increase in home values: 6.3%
- Median Sale Price: $169k
- Average Rent: $919
- Average Number of Leads per Property: 7
- Number of days on the rental market: 14
#30: Laurel, MS
- Nickname: “The City Beautiful”
- Data Highlights: Laurel is one of two Mississippi towns that made the list. The median listing price is very affordable at $120k and leads are very strong at 20 per property, with a little under three weeks on the market. It’s an investment beaut.
Read the full Mississippi Report
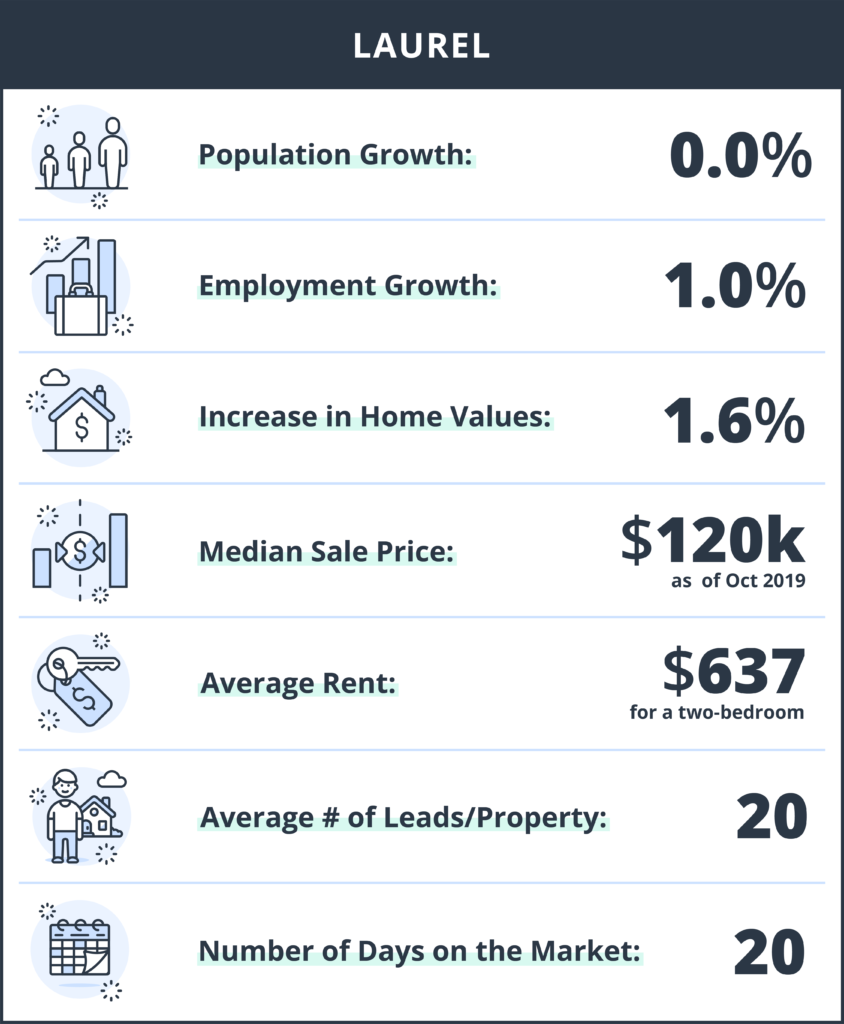
- Population growth: 0.0%
- Employment growth: 1.0%
- Increase in home values: 1.6%
- Median Listing Price: $120k
- Average Rent: $637
- Average Number of Leads per Property: 20
- Number of days on the rental market: 20
#29: Fort Wayne, IN
- Nickname: “Summit City”
- Data Highlights: The median listing price is extremely affordable at $139k. Leads are in the 20s and the number of days on the market comes in under two weeks.
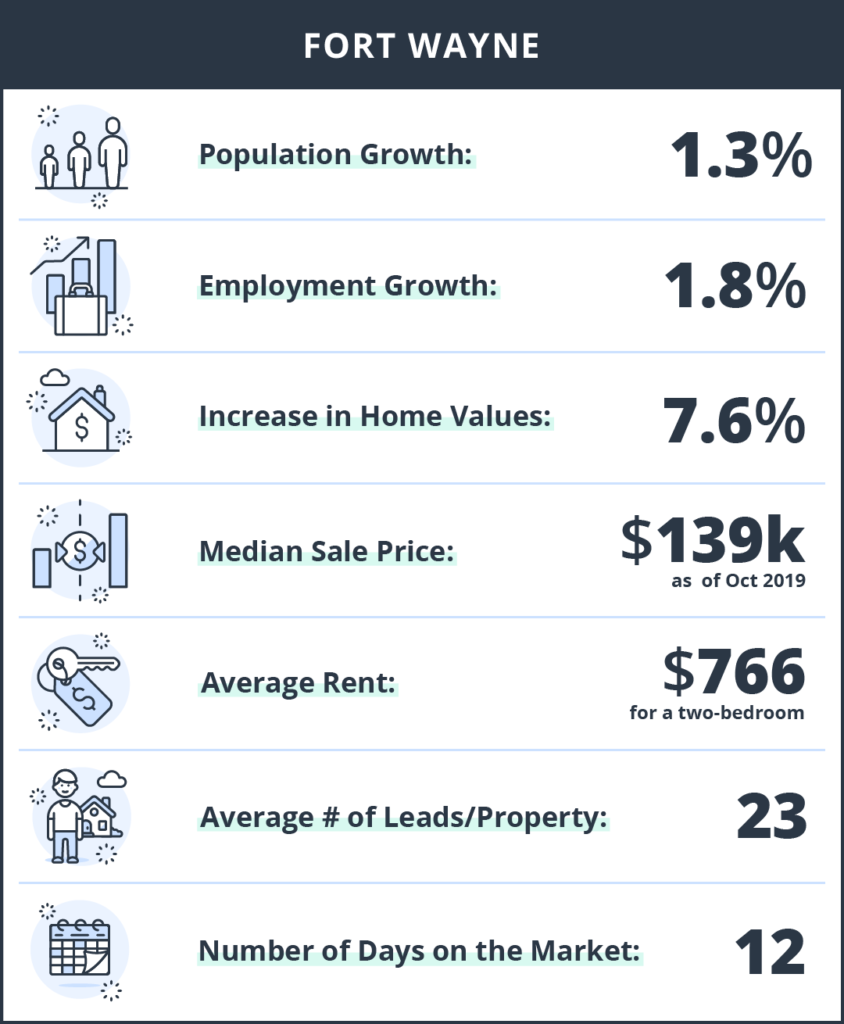
- Population growth: 1.3%
- Employment growth: 1.8%
- Increase in home values: 7.6%
- Median Listing Price: $139k
- Average Rent: $766
- Average Number of Leads per Property: 23
- Number of days on the rental market: 12
#28: Cedar Rapids, IA
- Nickname: “City of Five Seasons”
- Data Highlight: Both of our Iowa towns made the top investments for the 2020 list. Positive growth numbers were reported across the board. Leads are in the mid-twenties, with an average of 10 days on the market.
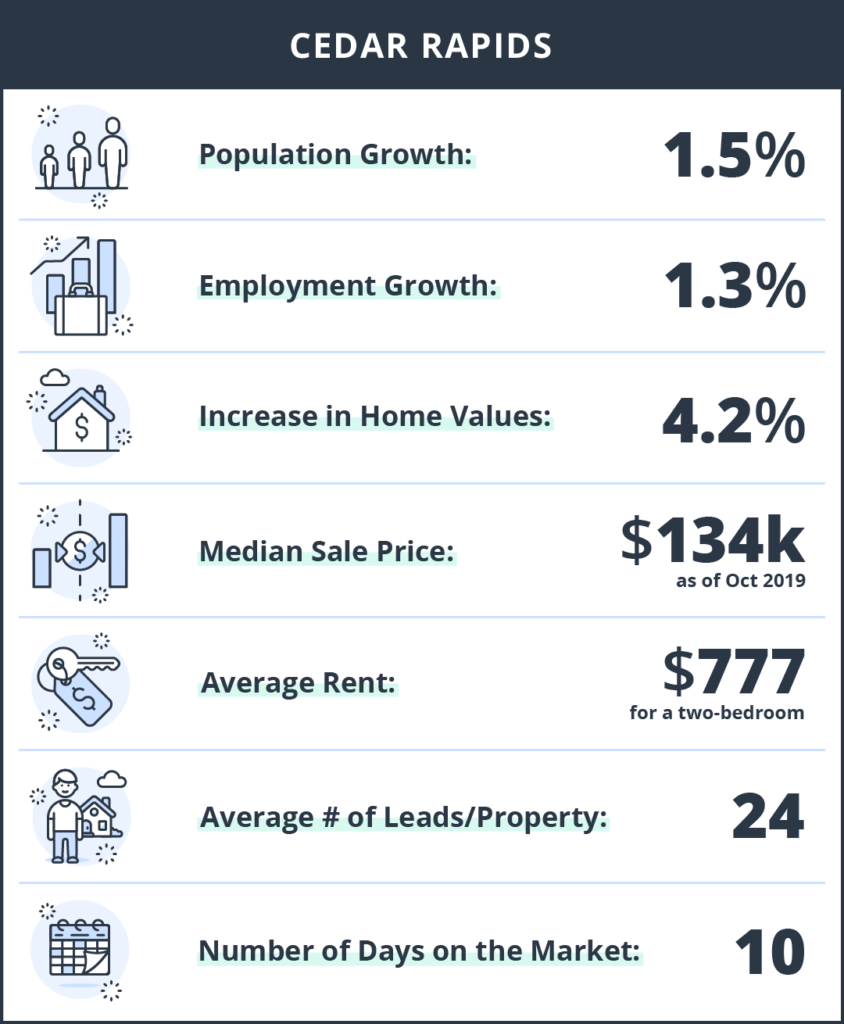
- Population growth: 1.5%
- Employment growth: 1.3%
- Increase in home values: 4.2%
- Median Sale Price: $134k
- Average Rent: $777
- Average Number of Leads per Property: 24
- Number of days on the rental market: 10
#27: Rogers, AR
- Motto: “Where Possible Lives”
- Data Highlights: The median sale price is very affordable at $155k and the average rent is in a great spot at $900. Nearly 25 leads per property and just 18 days on the market. Roger that!
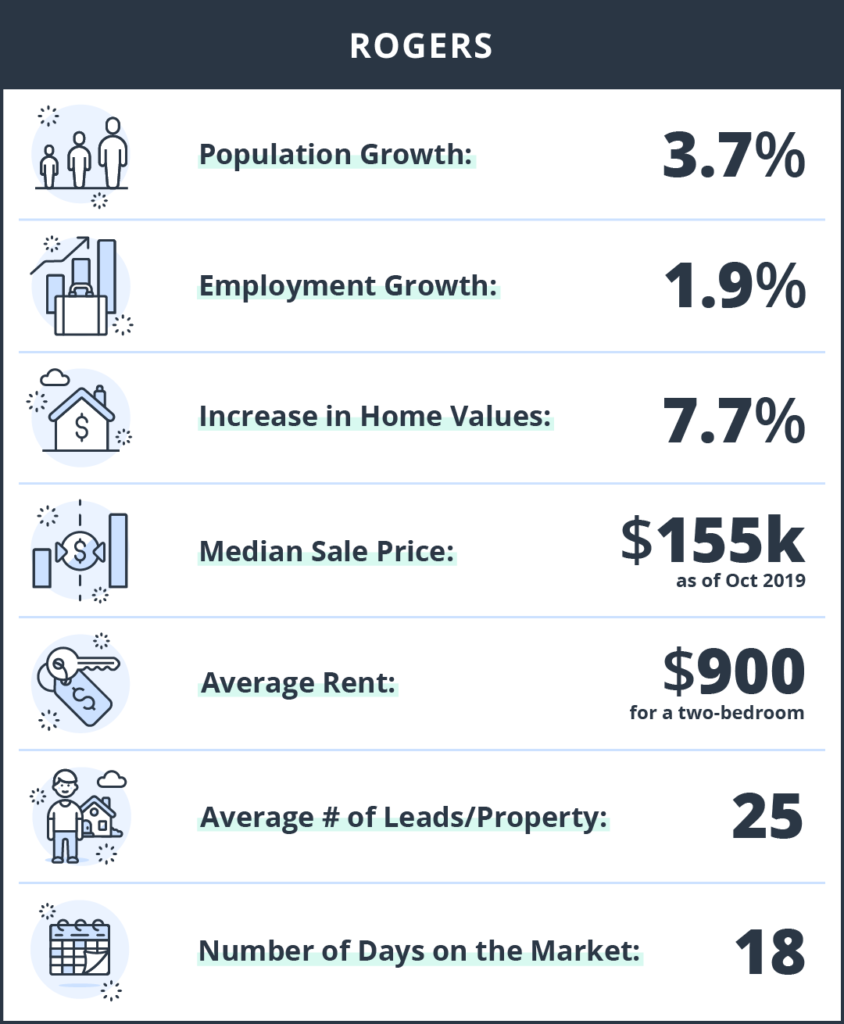
- Population growth: 3.7%
- Employment growth: 1.9%
- Increase in home values: 7.7%
- Median Sale Price: $155k
- Average Rent: $900
- Average Number of Leads per Property: 25
- Number of days on the rental market: 18
#26: Caldwell, ID
- Motto: “More to Offer”
- Data Highlights: Home values have seen the biggest increase on our list at 16.3% with population growth coming in at 6.4% year over year. Leads are very strong at 25 per property and less than a week on the market.
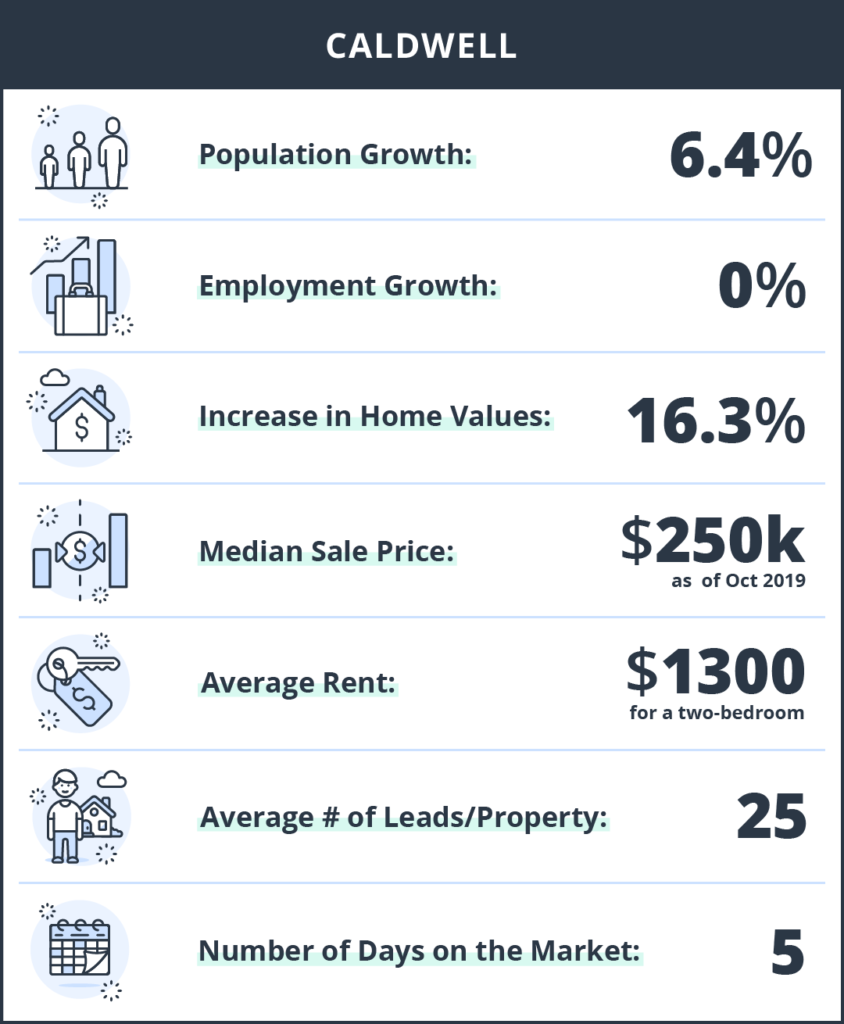
- Population growth: 6.4%
- Employment growth: 0%
- Increase in home values: 16.3%
- Median Listing Price: $250k
- Average Rent: $1300
- Average Number of Leads per Property: 25
- Number of days on the rental market: 5
#25: St. Petersburg, FL
- Motto: “Always in Season”
- Data Highlights: Double digit home values increases, 26 leads per property, strong average rent, and population and employment growth at 3.3% and 2.3% respectively. It is the only Florida town that made the list, and it’s always a good choice…. well at least for 2020.
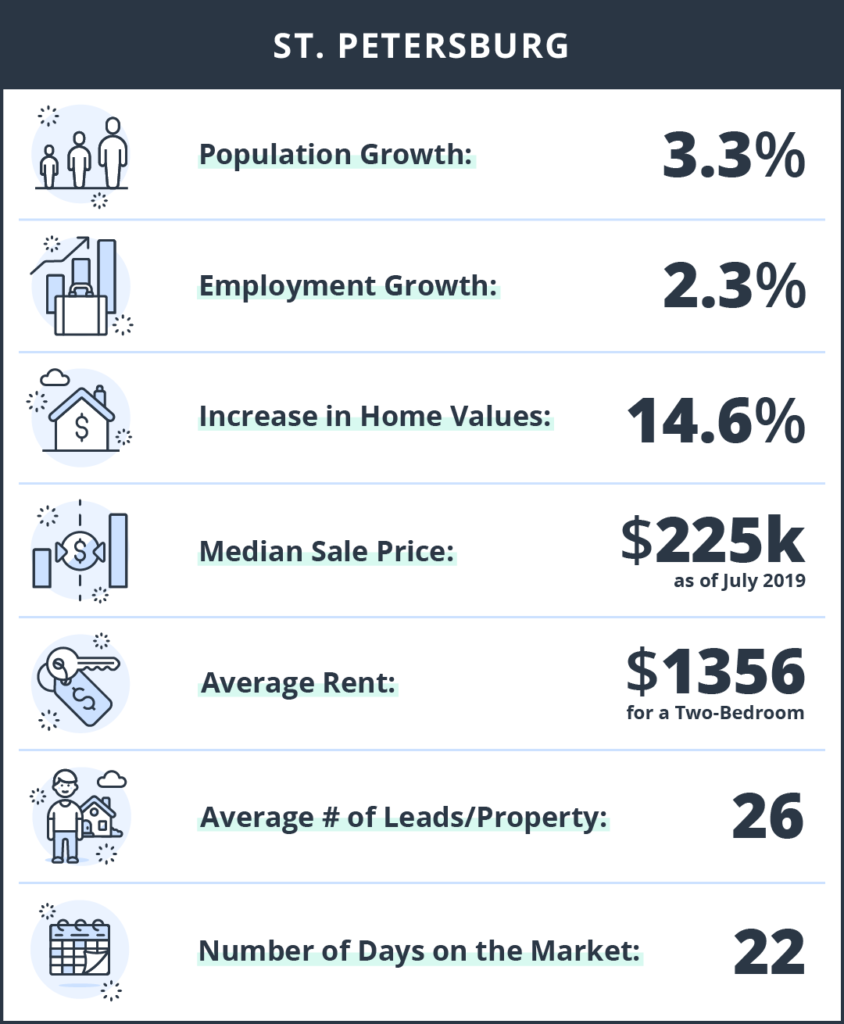
- Population growth: 3.3%
- Employment growth: 2.3%
- Increase in home values: 14.6%
- Median Sale Price: $225k
- Average Rent: $1356
- Average Number of Leads per Property: 26
- Number of days on the rental market: 22
#24 Fayetteville, NC
- Nickname: “All-America City”
- Data Highlights: Fayetteville is the only NC representative on the top investment list for 2020. It’s the second most affordable location on the list with a median home price of $110k. Rent is strong for that price point, coming in at $783 on average. Leads are in the mid 30s, with just 10 days on the market. Fayetteville is a home run.
Read the full North Carolina Report
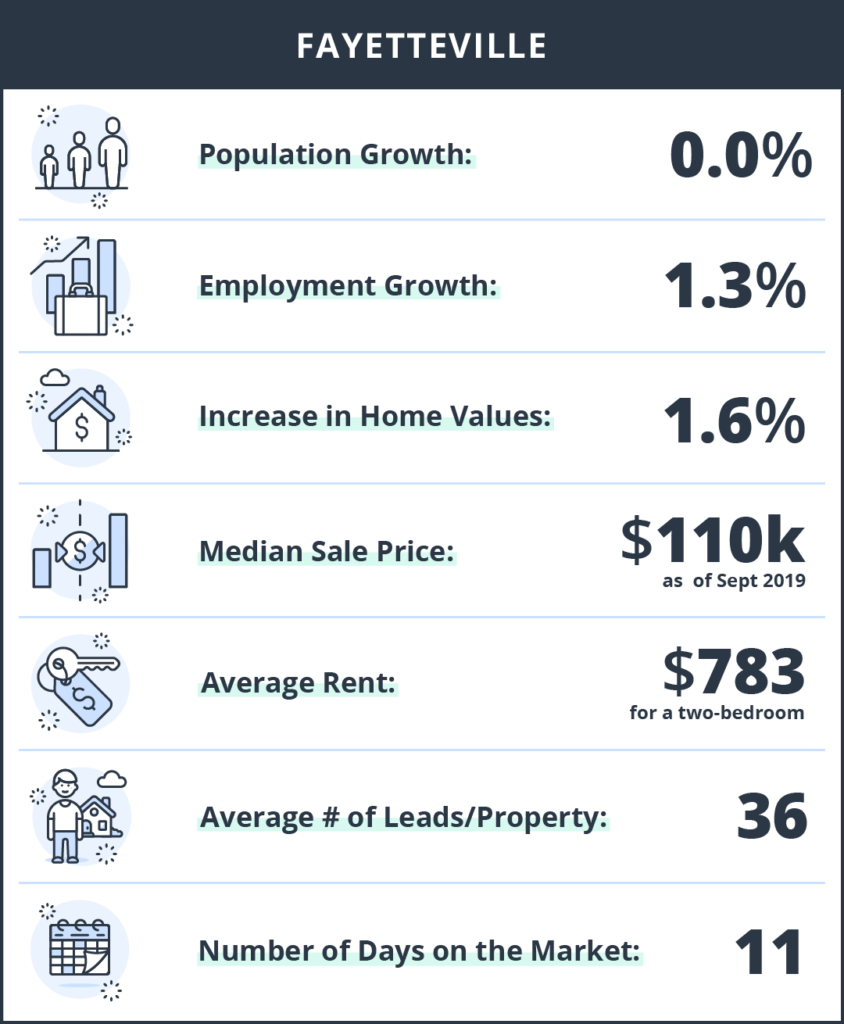
- Population growth: 0%
- Employment growth: 1.3%
- Increase in home values: 1.6%
- Median Home Price: $110k
- Average Rent: $783
- Average Number of Leads per Property:36
- Number of days on the rental market: 11
#23: Great Falls, MT
- Nickname: “The Electric City”
- Data Highlights: Landlords are getting nearly 50 leads per property with just 10 days on the market. Home values are on the rise, but still coming in under $200k with an average rent of $1100. Way to light it up Great Falls!
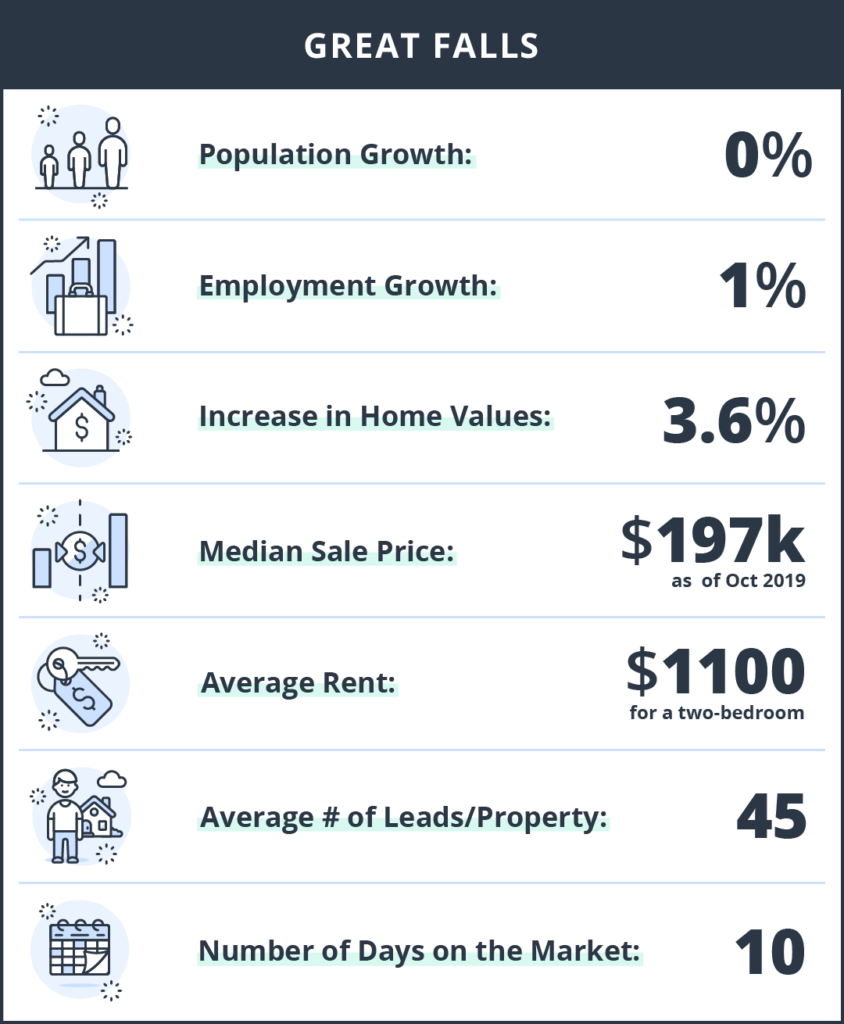
- Population growth: 0%
- Employment growth: 1%
- Increase in home values: 3.6%
- Median Sale Price: $197k
- Average Rent: $1100
- Average Number of Leads per Property: 45
- Number of days on the rental market: 10
#22: Kansas City, MO
- Nickname: “KCMO”
- Data Highlights: KC’s rental properties are smokin’. Almost 50 leads per property was reported. The time on market is the longest on the list at 32 days. Home values have seen double digit increases at 11.5% year over year.
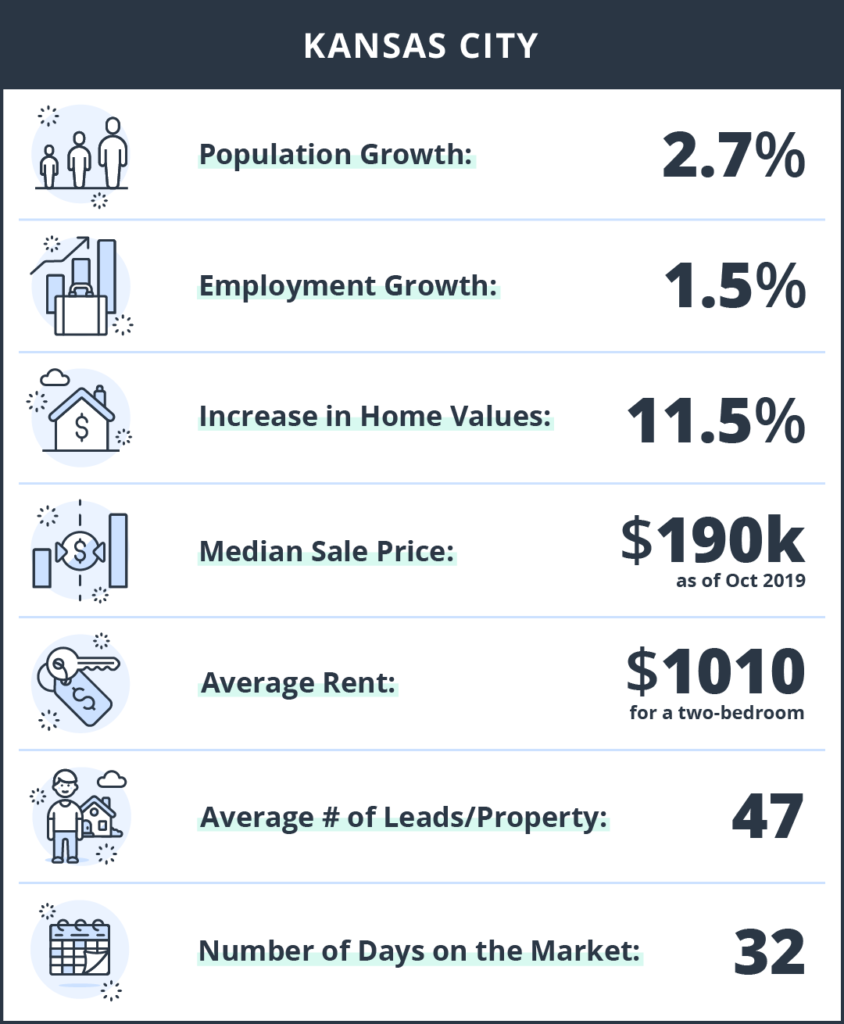
- Population growth: 2.7%
- Employment growth: 1.5%
- Increase in home values: 11.5%
- Median Sale Price: $190k
- Average Rent: $1,010
- Average Number of Leads per Property: 47
- Number of days on the rental market: 32
#21: Des Moines, IA
- Nickname: “Hartford of the West”
- Data Highlights: Des Moines – where the s’s are silent and the things to do are endless. Median sale prices are only $144k with an average rent of $933. Landlords won’t be disappointed with 48 leads per property and only 17 days on the rental market!
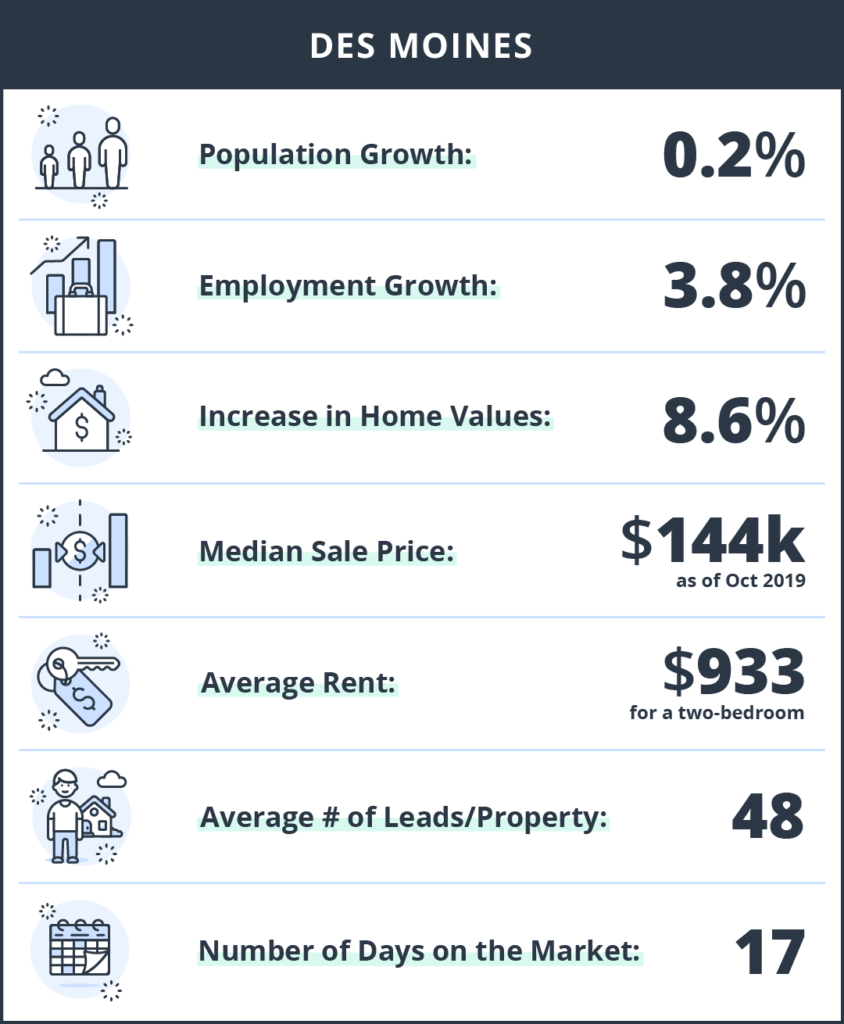
- Population growth: 0.2%
- Employment growth: 3.8%
- Increase in home values: 8.6%
- Median Sale Price: $144k
- Average Rent: $933
- Average Number of Leads per Property: 48
- Number of days on the rental market: 17
#20: Columbus, OH
- Nickname: The Discovery City
- Data Highlights: All three Ohio towns make our best of list for 2020. Landlords in the capital city are getting a whopping 52 leads per property with a little over two weeks on the market.
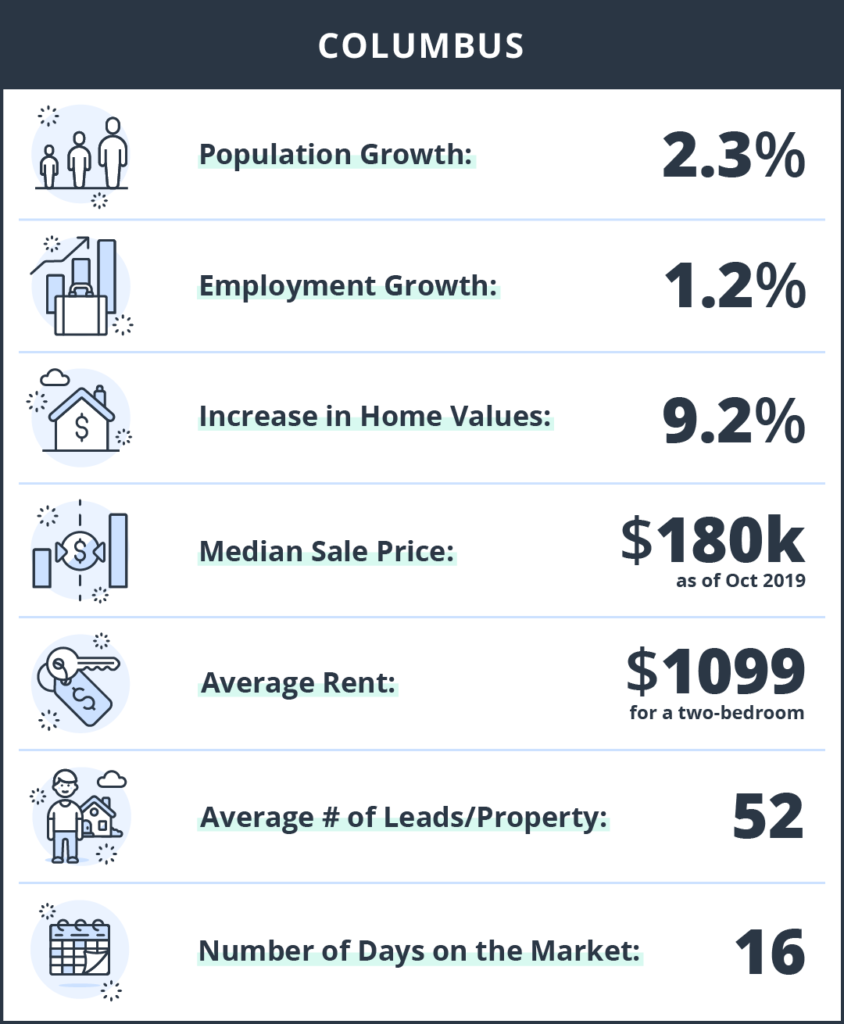
- Population growth: 2.3%
- Employment growth: 1.2%
- Increase in home values: 9.2%
- Median Sale Price: $180k
- Average Rent: $1099
- Average Number of Leads per Property: 52
- Number of days on the rental market: 16
#19: Independence, MO
- Nickname: “City of Trails”
- Data Highlights: Independence is putting up the numbers when it comes to leads and days on the market – 54 and 18 respectively.
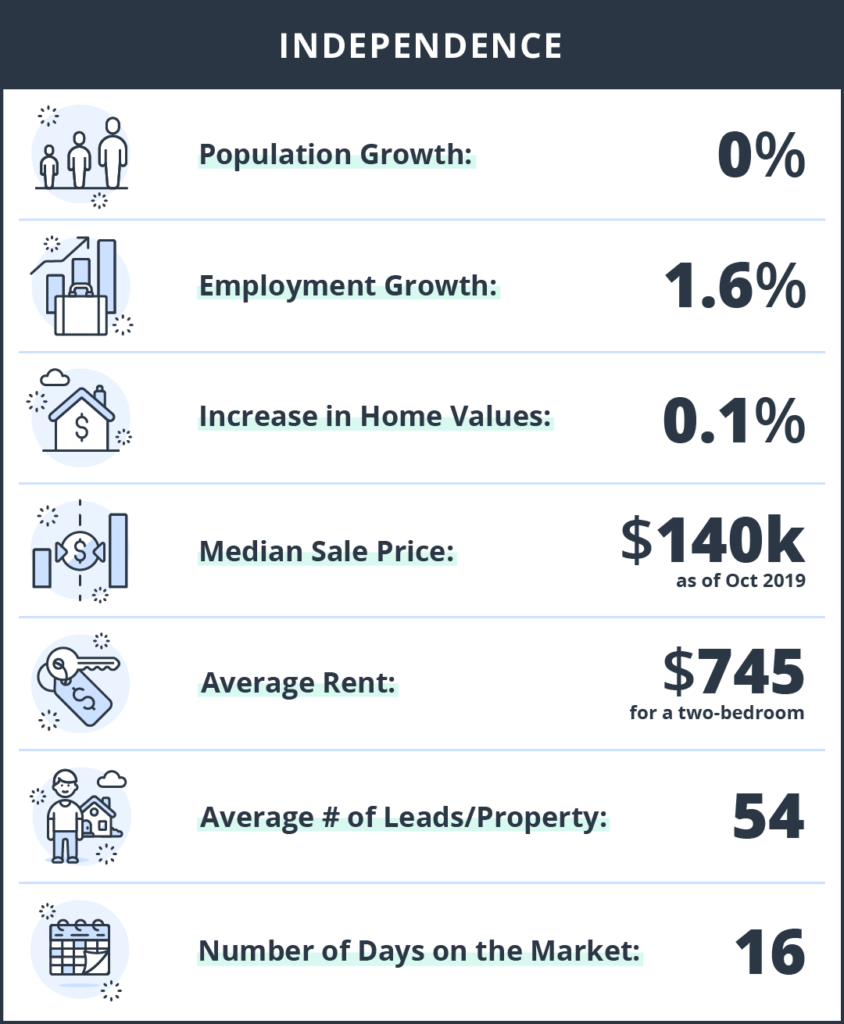
- Population growth: 0%
- Employment growth: 1.6%
- Increase in home values: 0.1%
- Median Sale Price: $140k
- Average Rent: $745
- Average Number of Leads per Property: 54
- Number of days on the rental market: 16
#18: Gulf Port, MS
- Motto: “Where Your Ship Comes In”
- Data Highlights: Gulfport was the number one pick in Mississippi. This coastal town puts up the numbers, nearly a 100 leads per property and just 16 days on the market.
Read the full Mississippi Report
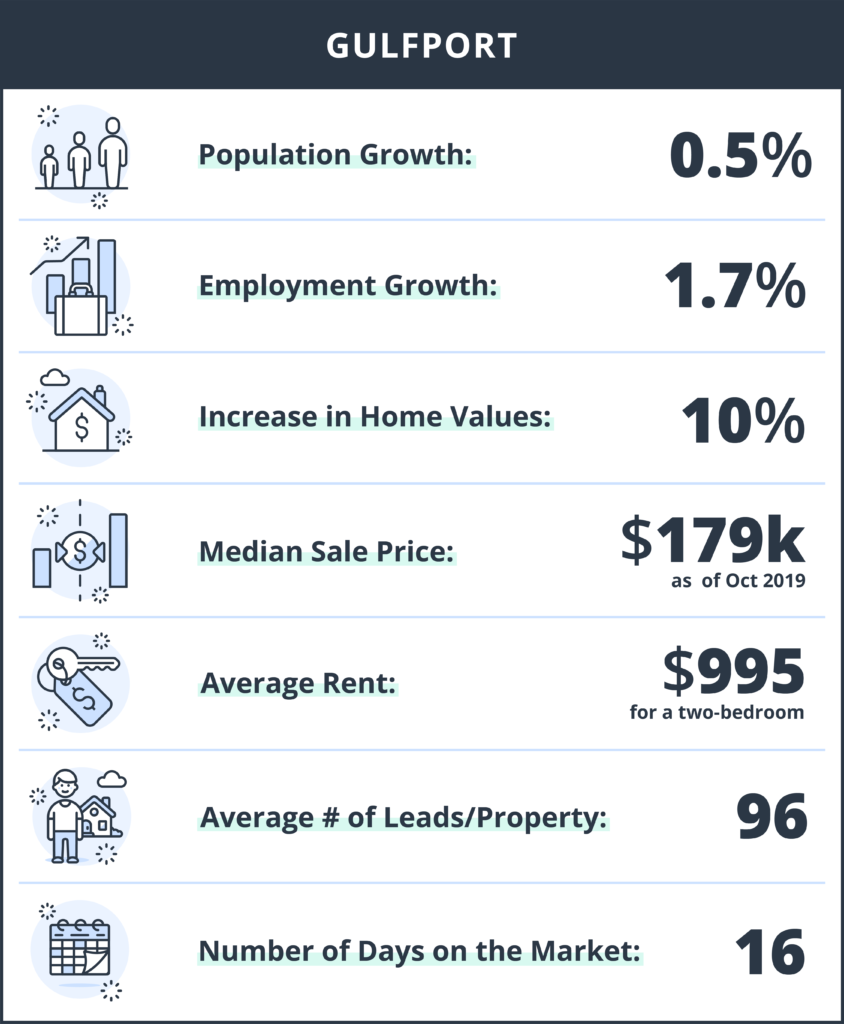
- Population growth: .5%
- Employment growth: 1.7%
- Increase in home values: 10%
- Median Listing Price: $179k
- Average Rent: $995
- Average Number of Leads per Property: 96
- Number of days on the rental market: 16
#17: Memphis, TN
- Motto: “Home of Blues, Soul & Rock ‘N’ Roll”
- Data Highlights: You can’t help falling in love with Memphis, and its great investment opportunities. The median sale price is nearly as cheap as what Elvis paid in 1957. You won’t have trouble renting your investment property out with 55 leads coming in on average and a little over two weeks on the market.
Read the full Tennessee Report
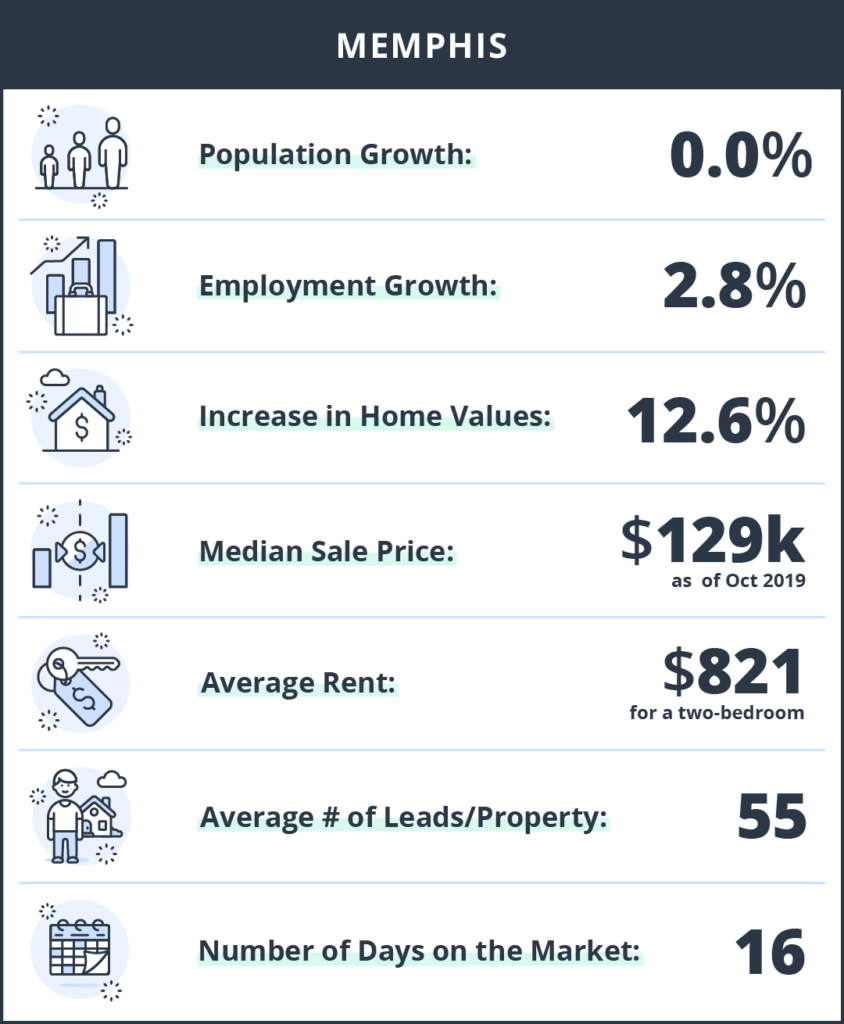
- Population growth: 0.0%
- Employment growth: 2.8%
- Increase in home values: 12.6%
- Median Sale Price: $129k
- Average Rent: $821
- Average Number of Leads per Property: 55
- Number of days on the rental market: 16
#16: Columbia, SC
- Motto: “Justice, the Queen of Virtues”
- Data Highlights: Home values are on the rise, but the median sale price still sits at $165k. Columbia is another member of the 50+ leads per property club, and in 12 days your investment property will be rented in no time in Columbia.
Read the full South Carolina Report
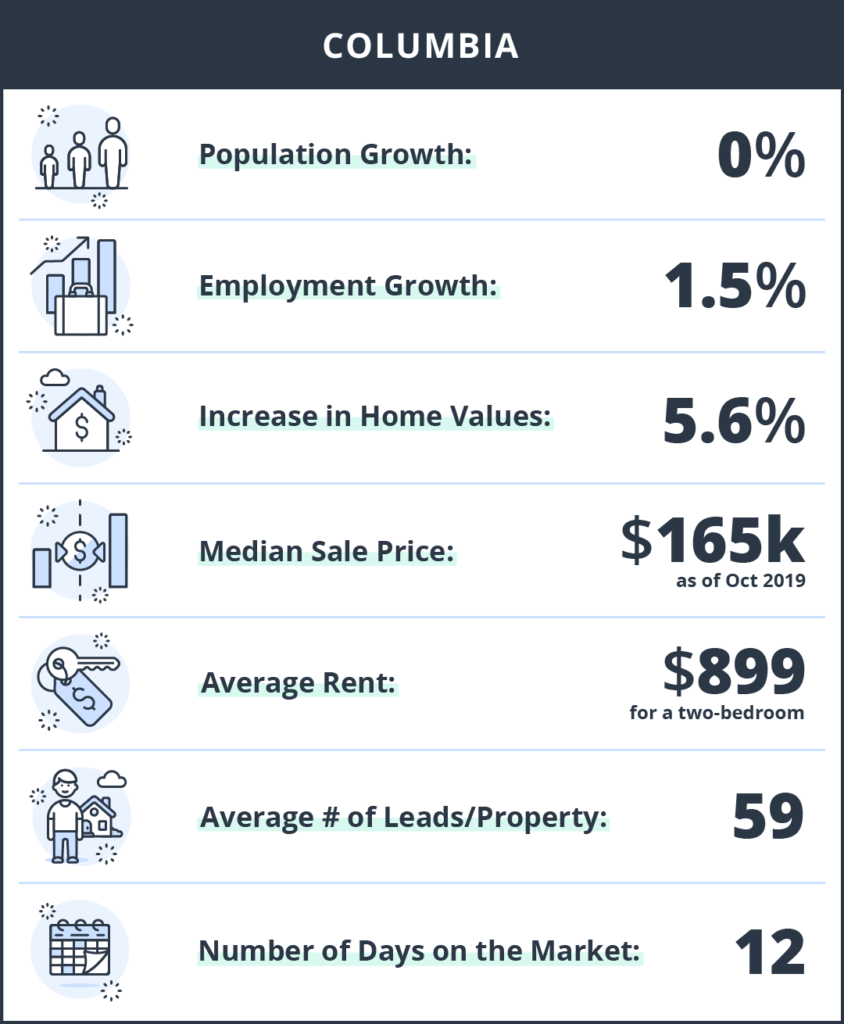
- Population growth: 0%
- Employment growth: 1.5%
- Increase in home values: 5.6%
- Median Sale Price: $165k
- Average Rent: $899
- Average Number of Leads per Property: 59
- Number of days on the rental market: 12
#15: Grand Rapids, MI
- Motto: “Strength in activity”
- Data Highlights: Take a seat and listen to these stats from “Furniture City,” median sale price of $193k, average rent amount at $1129, 72 leads per property, 20 days on the market. Now relax, you’ve found a great investment opportunity.
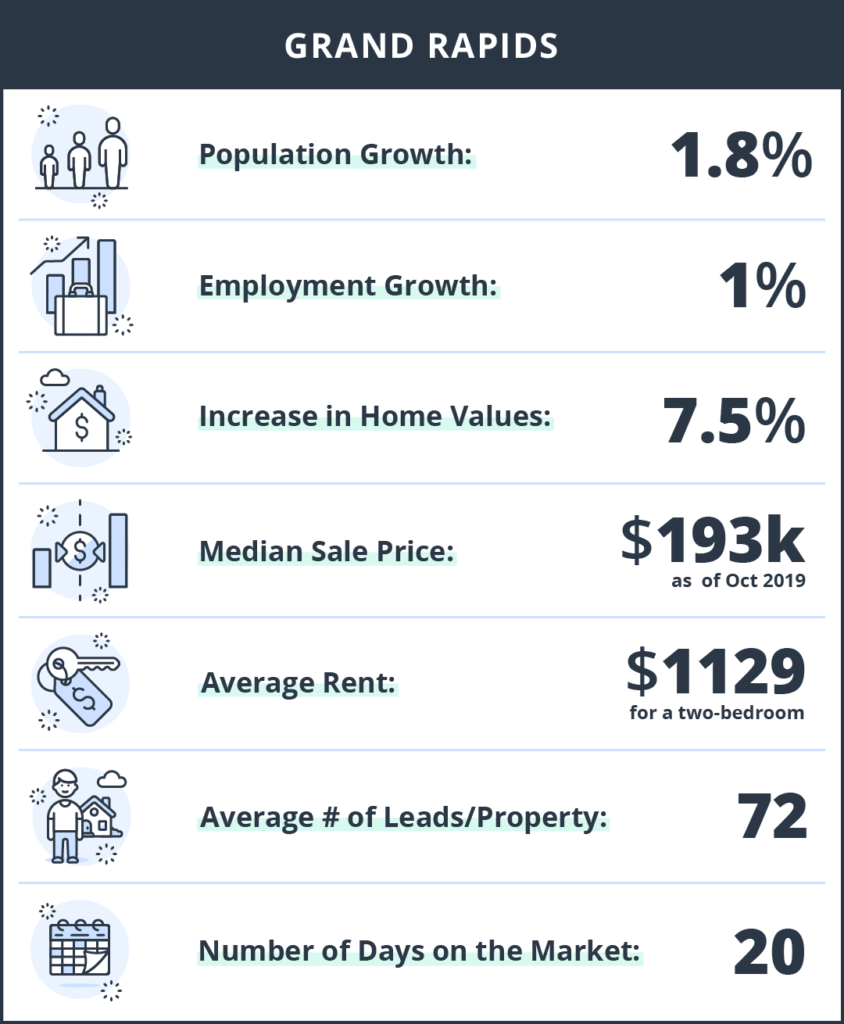
- Population growth: 1.8%
- Employment growth: 1%
- Increase in home values: 7.5%
- Median Sale Price: $193k
- Average Rent: $1129
- Average Number of Leads per Property: 72
- Number of days on the rental market: 20
#14: Schenectady, NY
- Motto: “The horse that won the Belmont, #18. The horse was from Schenectady “
- Data Highlights: The median home price is $160k and the average rent price is $1319, predicting a strong ROI. Leads are nearly 75 per property and a touch under three weeks on the market.
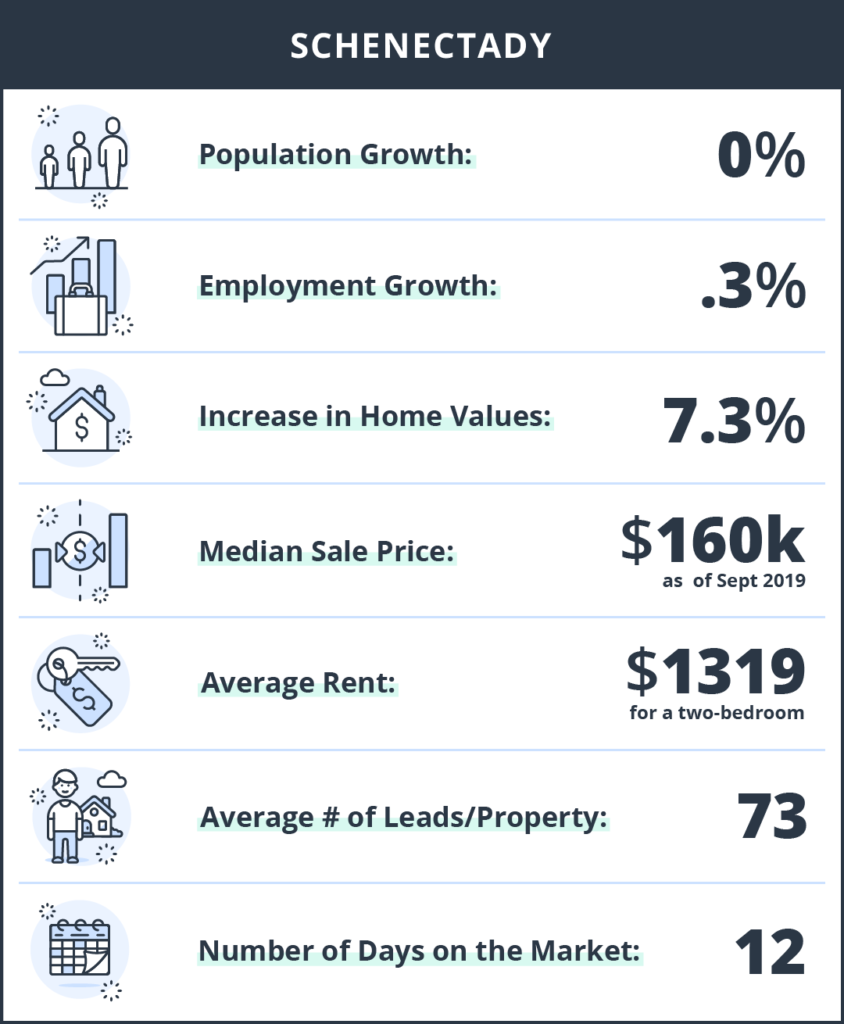
- Population growth: 0%
- Employment growth: .3%
- Increase in home values: 7.3%
- Median Home Price: $160k
- Average Rent: $1319
- Average Number of Leads per Property: 73
- Number of days on the rental market: 12
#13: Buffalo, NY
- Nicknames: The Queen City
- Data Highlights: Another strong ROI is predicted: $160k median home price and $1020 for an average rent price. We are getting into the crazy high lead zone, 82 on average per property, and 12 days on the market.

- Population growth: 1%
- Employment growth: 1%
- Increase in home values: 8.5%
- Median Home Price: $160k
- Average Rent: $1020
- Average Number of Leads per Property: 82
- Number of days on the rental market: 12
#12: Manchester, NH
- Nickname: Queen City
- Data Highlights: Home values are still in an affordable range and increasing over 10% year over year. Rent is strong at $1452 and the leads per property is a whooping 82, with a little over two weeks on the market.
Read the full New Hampshire Report
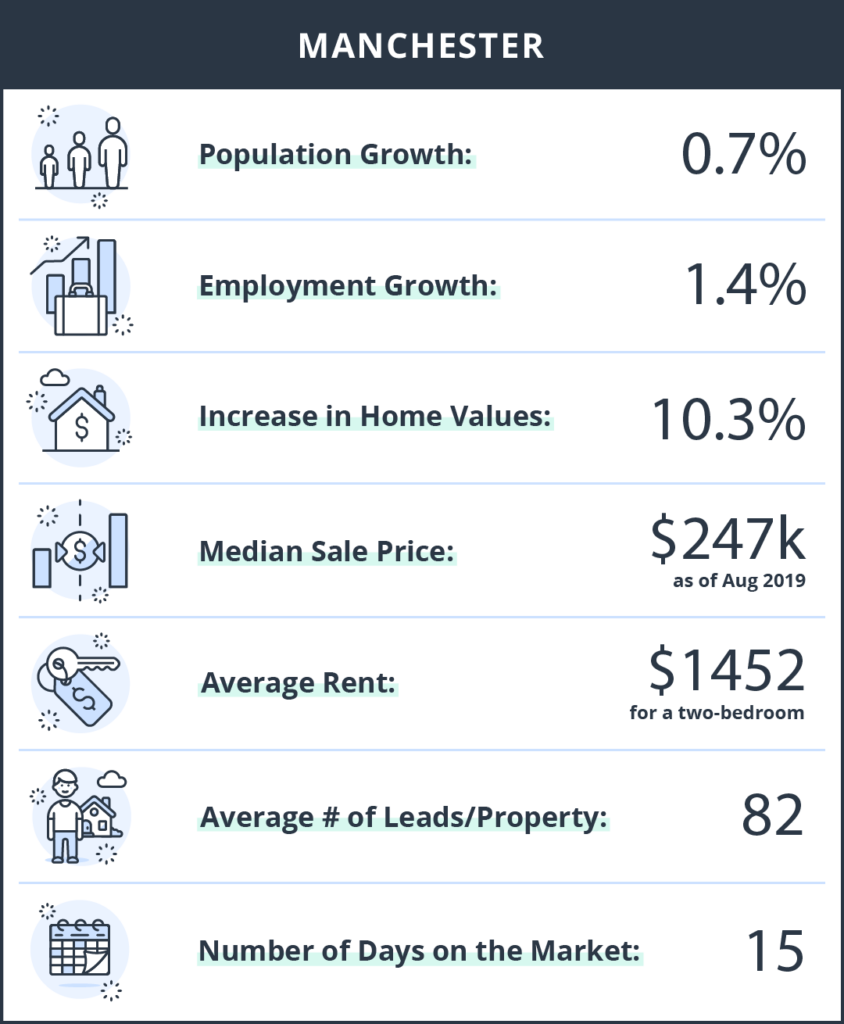
- Population growth: 0.7%
- Employment growth: 1.4%
- Increase in home values: 10.3%
- Median Sale Price: $247k
- Average Rent: $1,452
- Average Number of Leads per Property: 82
- Number of days on the rental market: 15
#11: Akron, OH
- Nickname: Rubber City
- Data Highlights: Home values are on the rise at 8.7%, and that’s still with a median sale price of $103k. Rent is strong at $757, and leads are coming in at 84 with approximately two weeks on the market.
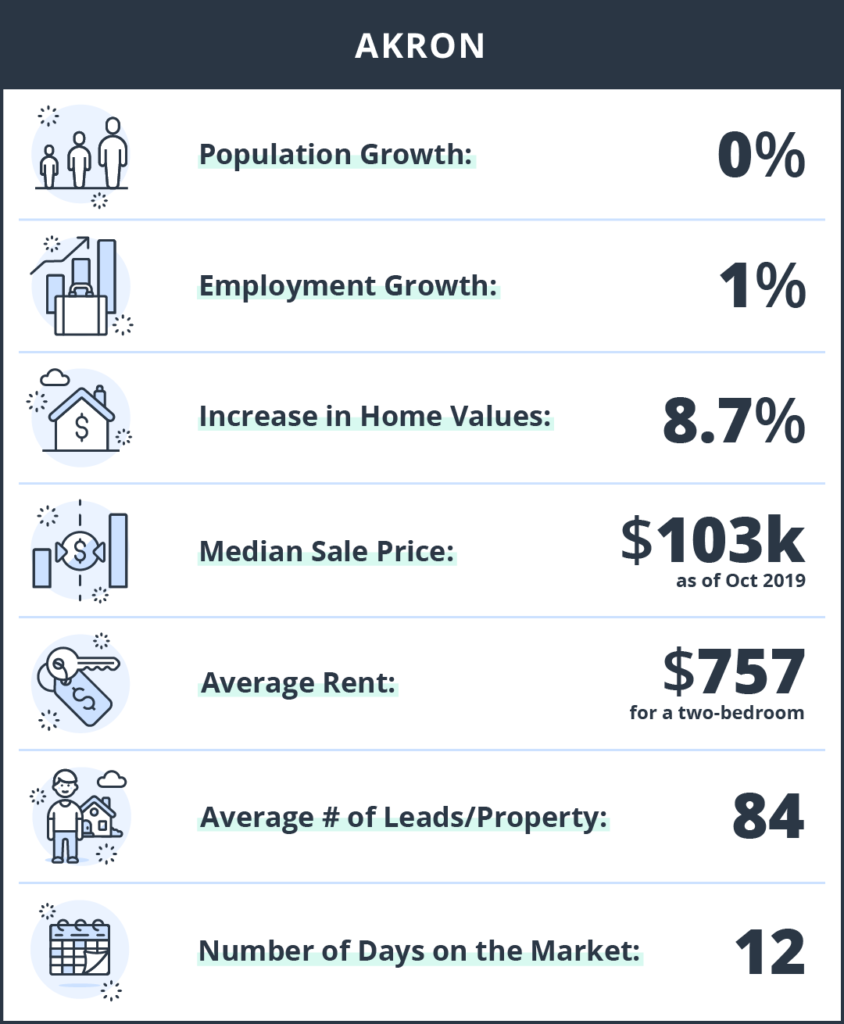
- Population growth: 0%
- Employment growth: 1%
- Increase in home values: 8.7%
- Median Sale Price: $103k
- Average Rent: $757
- Average Number of Leads per Property: 84
- Number of days on the rental market: 12
#10: Hyattsville, MD
- Motto: “A World Within Walking Distance”
- Data Highlights: Hyattsville has great numbers to report in all categories: Median sale price – $279k, average rent – $1982, leads – 86, days on market – 25.
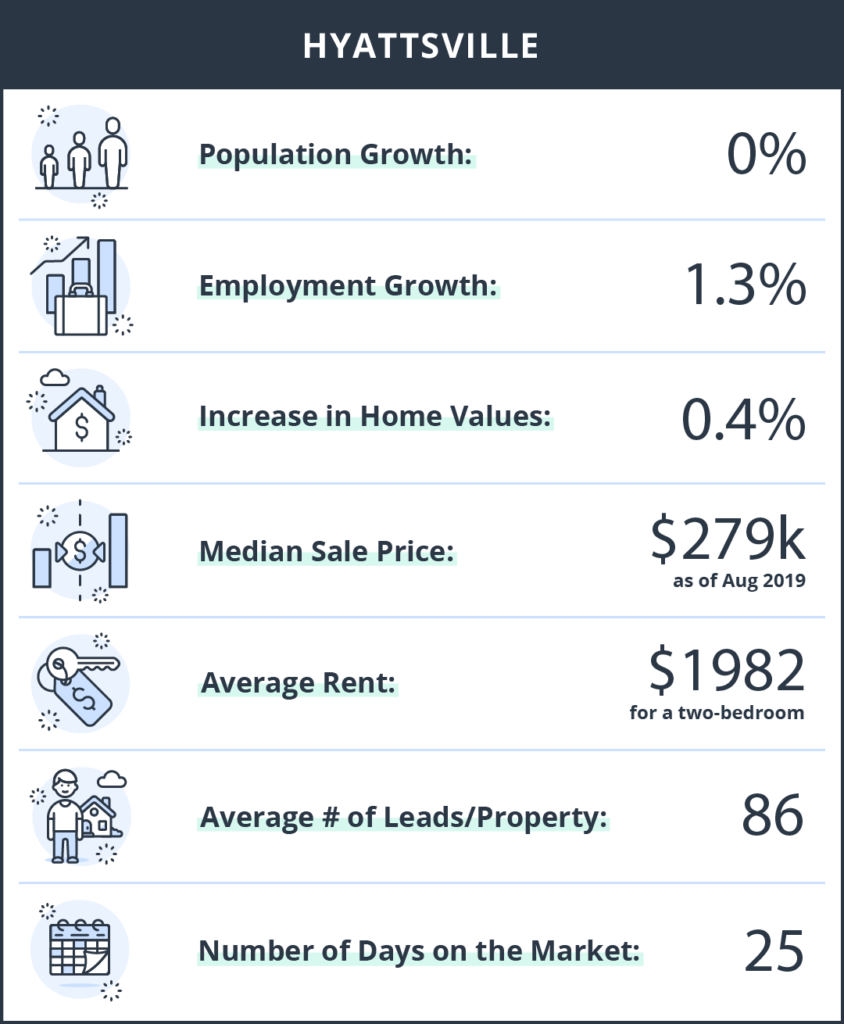
- Population growth: 0%
- Employment growth: 1.3%
- Increase in home values: 0.4%
- Median Sale Price: $279k
- Average Rent: $1,982
- Average Number of Leads per Property: 86
- Number of days on the rental market: 25
#9: Rochester, NY
- Nickname: “The Flour City”
- Data Highlights: Buffalo is considered one of the “most livable cities,” and the data supports that. Landlords are getting 96 leads per property with an average of 16 days on the market. The median home price sits at $136k with an average rent coming in around $1126.
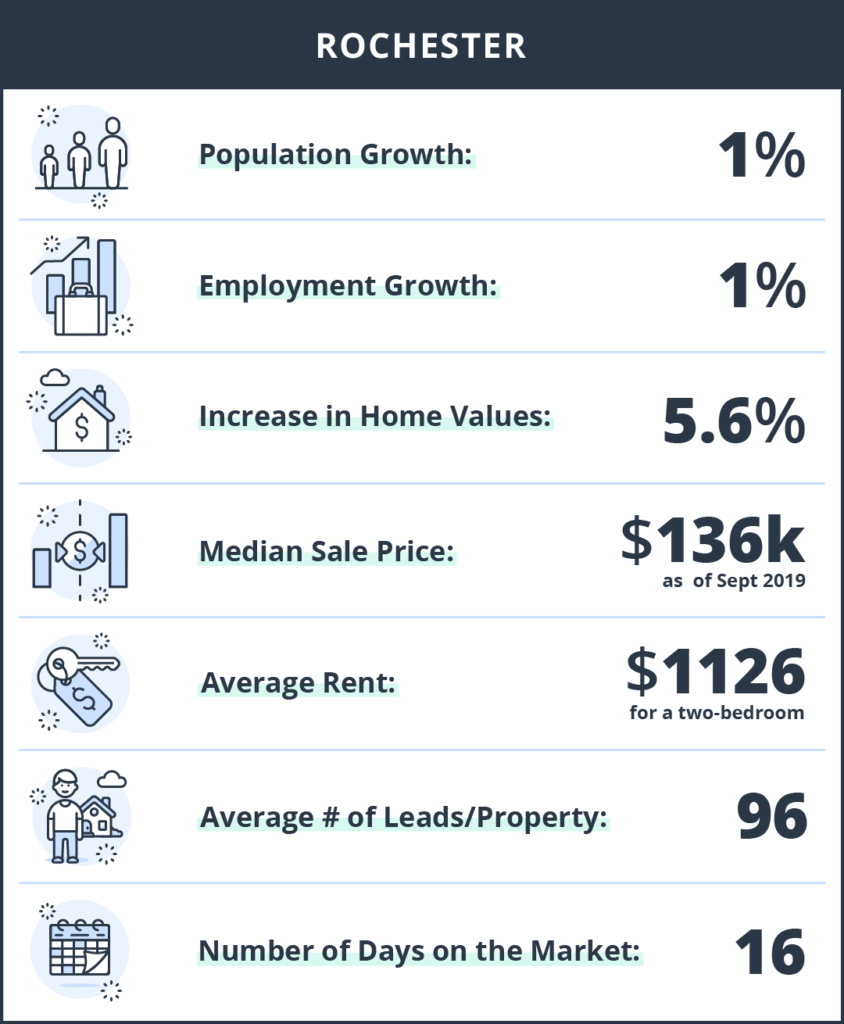
- Population growth: 1%
- Employment growth: 1%
- Increase in home values: 5.6%
- Median Home Price: $136k
- Average Rent: $1126
- Average Number of Leads per Property: 96
- Number of days on the rental market: 16
#8: New Castle, DE
- Data Highlights: New Castle is a small town, but quite mighty when it comes to leads and days on the market. Landlords are getting an average of 98 leads per property and one day on the market on average. The median sale price is under $200k and the average rent is very strong at nearly $2000.
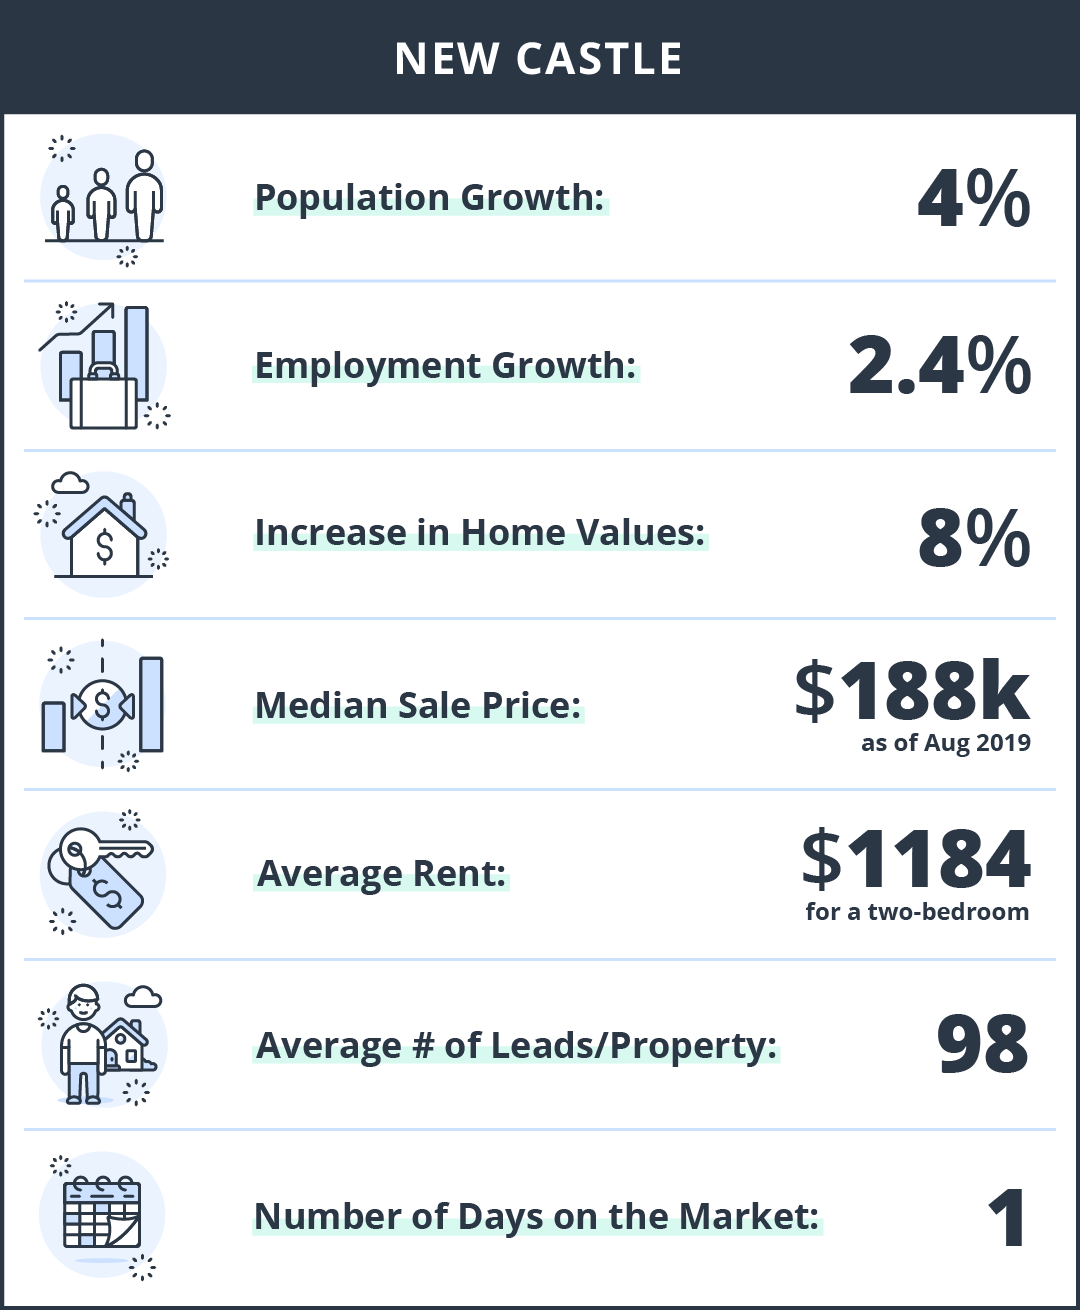
- Population growth: 4%
- Employment growth: 2.4%
- Increase in home values: 8%
- Median Sale Price: $188k
- Average Rent: $1184
- Average Number of Leads per Property: 98
- Number of days on the rental market: 1
#7: Paterson, NJ
- Nickname: The Silk City
- Data Highlights: Paterson is putting up some great numbers. One hundred leads per property, a median sale price of $268k and a strong average rent at $1614.
Read the full New Jersey Report

- Population growth: 0%
- Employment growth: 1%
- Increase in home values: 11.9%
- Median Sale Price: $268k
- Average Rent: $1,614
- Average Number of Leads per Property: 100
- Number of days on the rental market: 28
#6: Cincinnati, OH
- Motto:”Strength in Unity”
- Data Highlights: Strength in unity and strength in numbers for Cincinnati. It’s pulling in 100 leads per property, with about two weeks on the market. The median sale price is very affordable at $163k with strong rents reported at $1048.
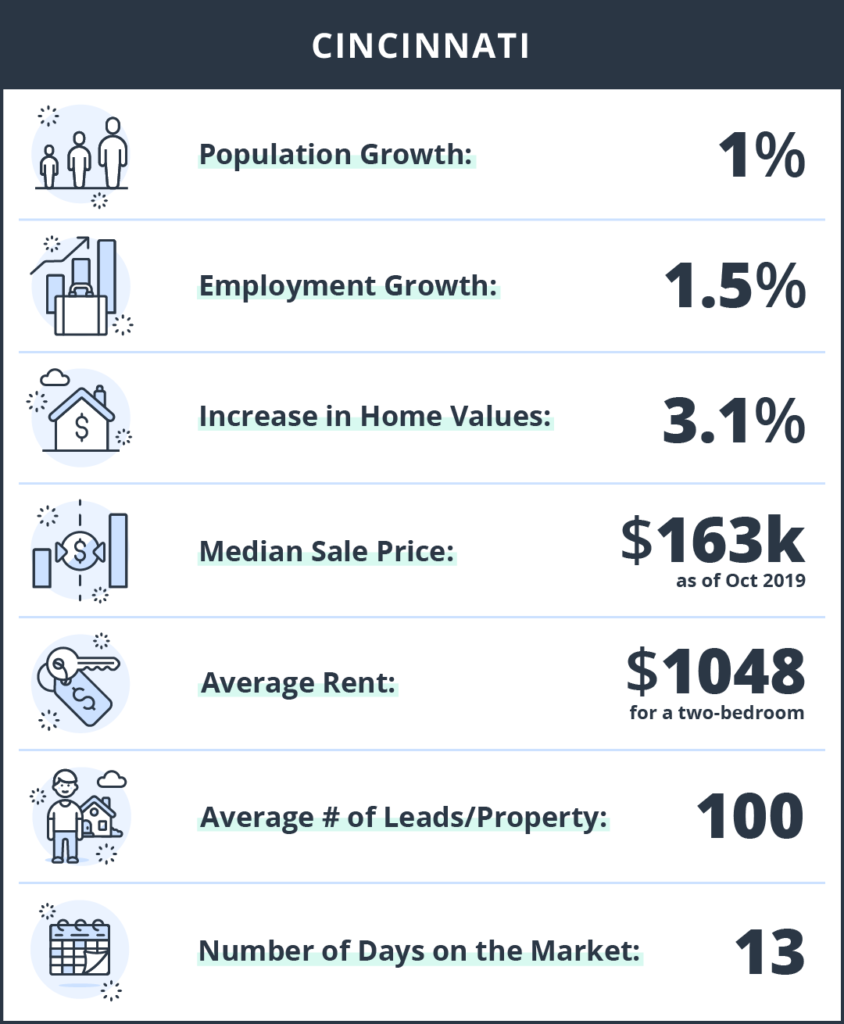
- Population growth: 1%
- Employment growth: 1.5%
- Increase in home values: 3.1%
- Median Sale Price: $163k
- Average Rent: $1048
- Average Number of Leads per Property: 100
- Number of days on the rental market: 13
#5: Nashua, NH
- Nickname: Gate City
- Data Highlights: Nashua is full of investment potential. As our #5 town, it’s putting up some serious lead numbers, 105 on average per property, and an average of eight days on the market. Home values are on the rise, but still in an affordable range at $283k.
Read the full New Hampshire Report

- Population growth: 0.6%
- Employment growth: 1.8%
- Increase in home values: 4.5%
- Median Sale Price: $283k
- Average Rent: $1,524
- Average Number of Leads per Property: 105
- Number of days on the rental market: 8
#4: East Orange, NJ
- Data Highlights: Our number #4 town has some juicy numbers: 116 leads per property, 15 days on the market, 10% year over year home value increases.
Read the full New Jersey Report

- Population growth: 0%
- Employment growth: 1%
- Increase in home values: 10%
- Median Sale Price: $273k
- Average Rent: $1,534
- Average Number of Leads per Property: 116
- Number of days on the rental market: 15
#3: Allentown, PA
- Nickname: “The A”
- Data Highlights: Allentown gets an “A” in all categories: Leads – 119 per property, days on the market – 9, median sale price – $145k, average rent – $1063.
Read the full Pennsylvania Report
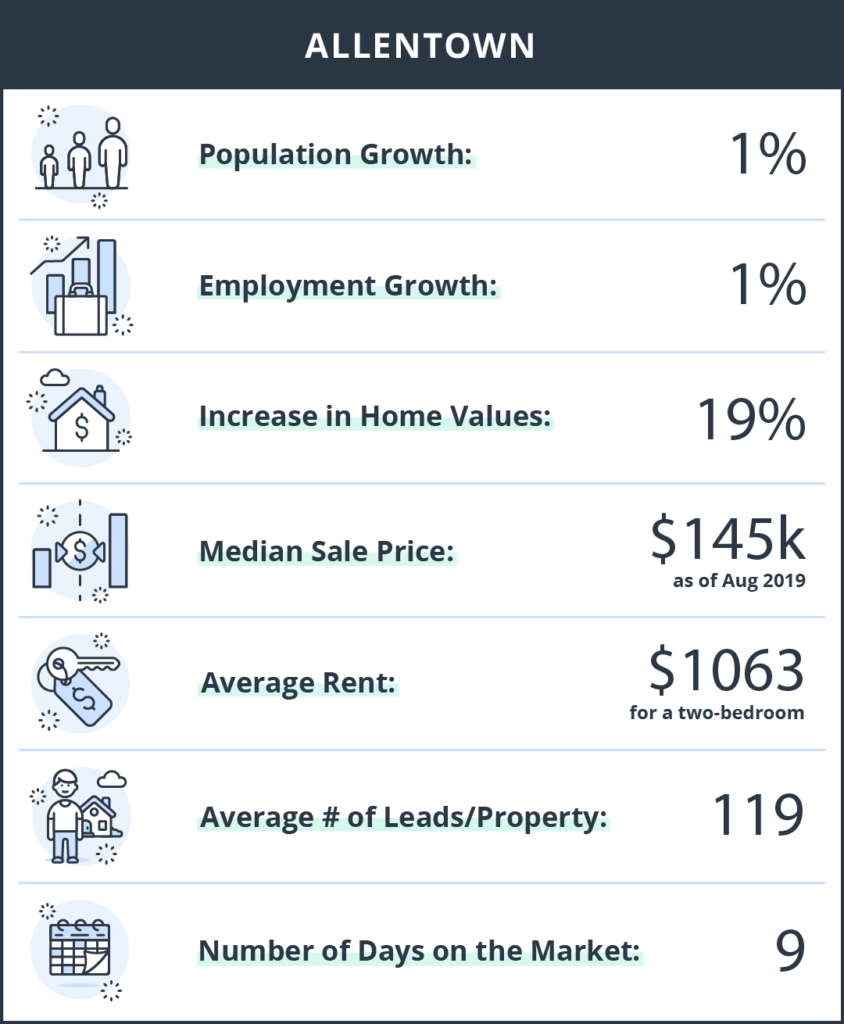
- Population growth: 1%
- Employment growth: 1%
- Increase in home values: 19%
- Median Sale Price: $145k
- Average Rent: $1063
- Average Number of Leads per Property: 119
- Number of days on the rental market: 9
#2: District Heights, MD
- Data Highlights: This D.C. suburb is small, but not when it comes to leads. Landlords are averaging 126 per property and just 19 days on the market.
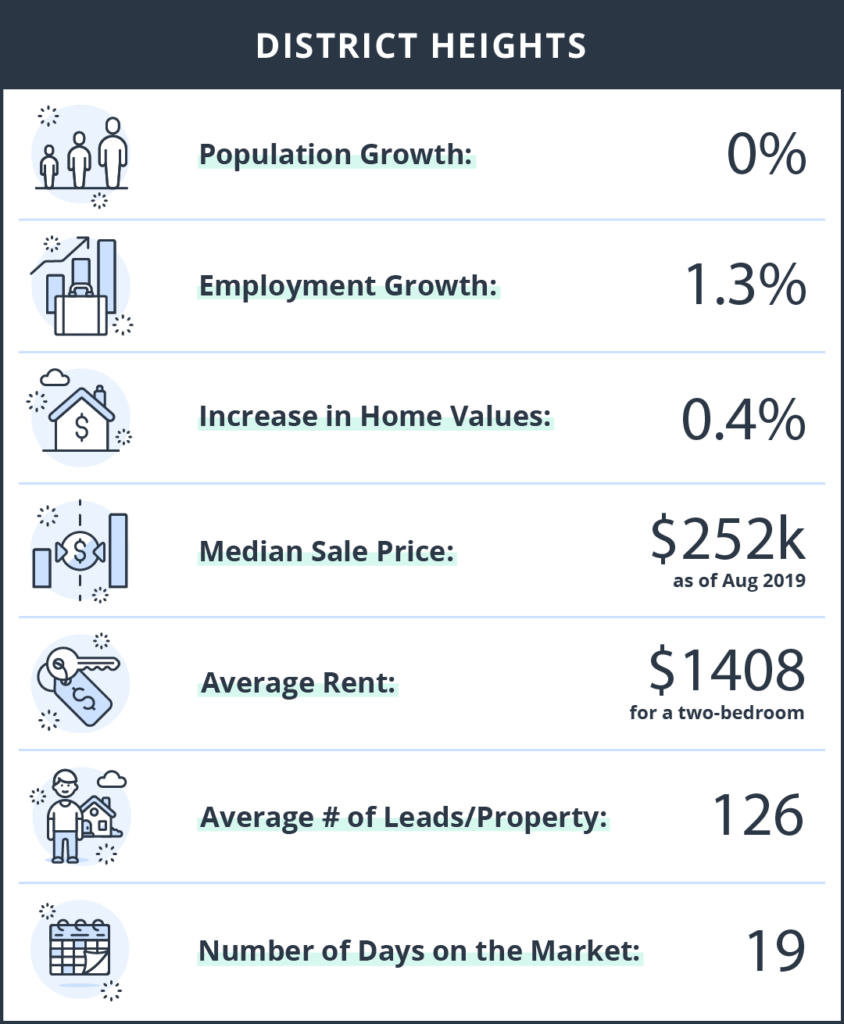
- Population growth: 0%
- Employment growth: 1.3%
- Increase in home values: 0.4%
- Median Sale Price: $252k
- Average Rent: $1,408
- Average Number of Leads per Property: 126
- Number of days on the rental market: 19
#1: Reading, PA
- Nickname: Baseballtown
- Data Highlights: Our number one town as seen positive growth across the board. The number of leads per property is the highest out of all of our towns at 271 with an average of eight days on the market. Home values are on the rise with an 11.1% increase year over year, with the median sale price reported at $140k.
Read the full Pennsylvania Report

- Population growth: 0.4%
- Employment growth: 1.2%
- Increase in home values: 11.1%
- Median Sale Price: $140k
- Average Rent: $957
- Average Number of Leads per Property: 271
- Number of days on the rental market: 8
Methodology:
In order to determine the best cities to invest in each state, we curated data from a number of reputable sources as well as using TurboTenant proprietary data. Our main city selections were taken from a study that evaluated four main factors for each city: employment growth, population growth, increase in home values and rental yield. We combined that with TurboTenant data on the average rent price, the number of rental leads per property, as well as the average number of days the rental stays on the market.
We also included an honorable mention where applicable. They are pulled from this study on the best places to invest in every state. These were determined using Zillow’s Buyer-Seller Index and Zillow Home Value Forecast, and AreaVibes’ Livability Score. Other methods for determining honorable mentions include using TurboTenant proprietary data to determine which cities return the best rental investment R.O.I. using data points including days on market, the number of leads per property, and average rent price.
DISCLAIMER: TurboTenant, Inc does not provide legal advice. This material has been prepared for informational purposes only. All users are advised to check all applicable local, state and federal laws and consult legal counsel should questions arise.
Sources:
- TurboTenant Rental Data
- The Best and Worst Cities to Own Investment Property
- Real Estate data provided by Redfin, a national real estate brokerage.